SBILIFE Elliott Wave technical analysis

Function: Larger Degree Trend Higher (Intermediate degree, orange). 

Mode: Motive.  

Structure: Impulse. 

Position: Minute Wave ((v)) Grey.  

Details: Minute Wave ((v)) looks complete around 1940 or could be soon terminating within Minor Wave 5 Grey of Intermediate Wave (5) Orange. Traders are advised to book profits here. 

Invalidation point: 1667.

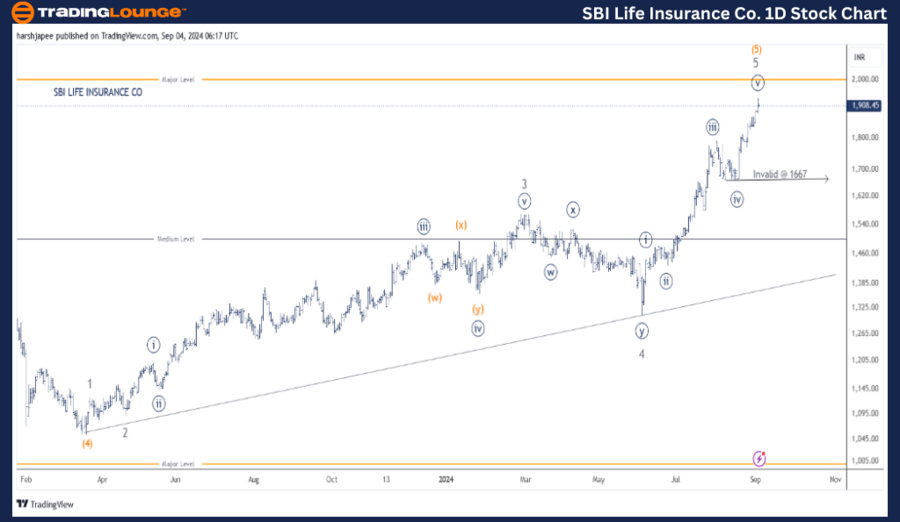
SBI Life Insurance Co. daily chart technical analysis and potential Elliott Wave counts: 

SBI Life Insurance Co daily chart is suggesting a potential top in place around 1940 level on Tuesday, September 13, 2024. The stock has slipped lower at open alongside Nifty 50 Index and is trading close to 1910 at the time of writing. 

SBI Life might have terminated its fifth wave at three different degrees; Minute, Minor and Intermediate as marked on the daily chart. The rally, which began from 1050 lows registered in March 2023 might be complete now. 

If the above wave counts hold true, SBI Life should turn lower from here and a break below 1667, which is Minute Wave ((iv)), would further confirm that bears are back in control. Traders should be looking to book profits on the longs taken earlier.

SBI

SBILIFE Elliott Wave technical analysis

Function: Larger Degree Trend Higher (Intermediate degree, orange). 

Mode: Motive. 

Structure: Impulse. 

Position: Minute Wave ((v)) Grey.  

Details: Minute Wave ((v)) looks complete around 1940 or could be soon terminating around 1950 mark, within Minor Wave 5 Grey of Intermediate Wave (5) Orange. Traders are advised to book profits here. 

Invalidation point: 1667.

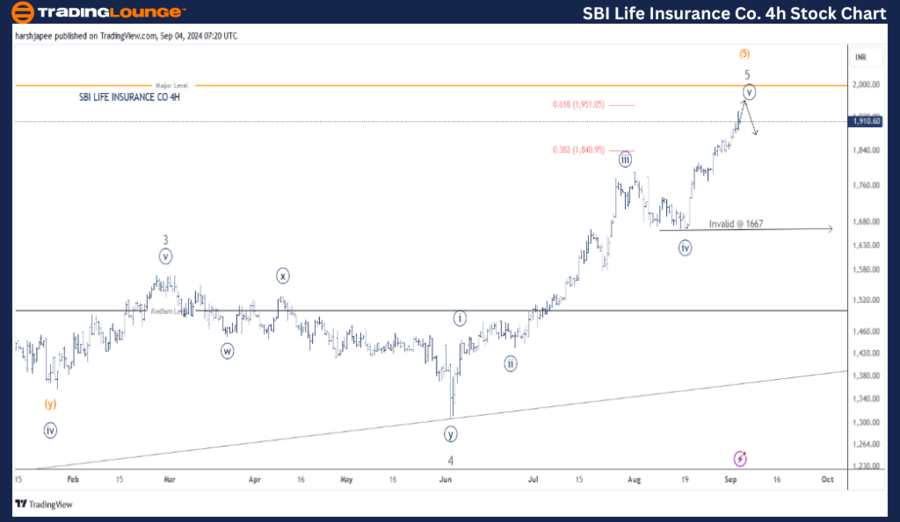
SBI Life Insurance Co. four-hour chart technical analysis and potential Elliott Wave counts:

SBI Life Insurance Co 4H chart also indicates that Minute Wave ((v)) Navy might be complete at 1940 high. Near term support is seen through 1838; and a break lower should be the first sign of a larger reversal ahead. The stock might face strong resistance around 1950 mark. 

Also note that fibonacci 1.618 extension of Minor Wave 5 is pointing towards 1951. It is quite possible that bulls attempt one last push before giving up. Either way, a potential top is near.

SBI

Conclusion

SBI Life Insurance Co might have terminated Minute Wave ((v)) within Minor Wave 5 Grey of Intermediate Wave (5) Orange around 1940.

SBI Life Insurance Co. Elliott Wave technical analysis [Video]

Share: Feed news

As with any investment opportunity there is a risk of making losses on investments that Trading Lounge expresses opinions on.

Historical results are no guarantee of future returns. Some investments are inherently riskier than others. At worst, you could lose your entire investment. TradingLounge™ uses a range of technical analysis tools, software and basic fundamental analysis as well as economic forecasts aimed at minimizing the potential for loss.

The advice we provide through our TradingLounge™ websites and our TradingLounge™ Membership has been prepared without considering your objectives, financial situation or needs. Reliance on such advice, information or data is at your own risk. The decision to trade and the method of trading is for you alone to decide. This information is of a general nature only, so you should, before acting upon any of the information or advice provided by us, consider the appropriateness of the advice considering your own objectives, financial situation or needs. Therefore, you should consult your financial advisor or accountant to determine whether trading in securities and derivatives products is appropriate for you considering your financial circumstances.

Recommended content


Recommended content

Editors’ Picks

AUD/USD looks bid ahead of RBA Minutes

AUD/USD looks bid ahead of RBA Minutes


Finally, AUD/USD managed to regain a small smile on Monday and retested the 0.6250 zone after six consecutive days of losses, all against the backdrop of a sharp pullback in the US Dollar and ahead of the release of the RBA Minutes.

AUD/USD News
EUR/USD meets some resistance just above 1.0500

EUR/USD meets some resistance just above 1.0500

EUR/USD reversed part of the recent leg lower and surpassed the 1.0500 barrier in response to the intense and renewed selling pressure hitting the US Dollar on Monday, all amid a solid recovery in the risk complex.

EUR/USD News
Gold battling to recover the $2,900 mark

Gold battling to recover the $2,900 mark

Gold continues to pull away from the multi-week low it set near $2,830 on Friday and trades above $2,880 in the second half of the day on Monday. The uncertainty surrounding the Trump administration's trade policy and retreating US yields after weak PMI data support XAU/USD.

Gold News
Bitcoin drops under $90,000, are institutions truly long BTC?

Bitcoin drops under $90,000, are institutions truly long BTC?

Bitcoin (BTC) climbed to a high of $94,416 early on Monday before erasing newfound gains and dropping under $90,000 support.

Read more
Seven fundamentals for the week: Angst rises ahead of tariff deadline and full buildup to Nonfarm Payrolls

Seven fundamentals for the week: Angst rises ahead of tariff deadline and full buildup to Nonfarm Payrolls Premium

A reality show in the White House – the world is still digesting the dressing down of Ukraine's President Volodymyr Zelenskyy in the White House, but markets have to focus on other actions of US President Donald Trump: tariffs. The dramas come in a week of top-tier data. It is time to fasten your seatbelts.

Read more
The Best brokers to trade EUR/USD

The Best brokers to trade EUR/USD

SPONSORED Discover the top brokers for trading EUR/USD in 2025. Our list features brokers with competitive spreads, fast execution, and powerful platforms. Whether you're a beginner or an expert, find the right partner to navigate the dynamic Forex market.

Read More

Forex MAJORS

Cryptocurrencies

Signatures

Best Brokers of 2025