Salesforce Inc. (CRM) Elliott Wave technical analysis [Video]
![Salesforce Inc. (CRM) Elliott Wave technical analysis [Video]](https://editorial.fxstreet.com/images/Markets/Equities/market-analyze-18914145_XtraLarge.jpg)
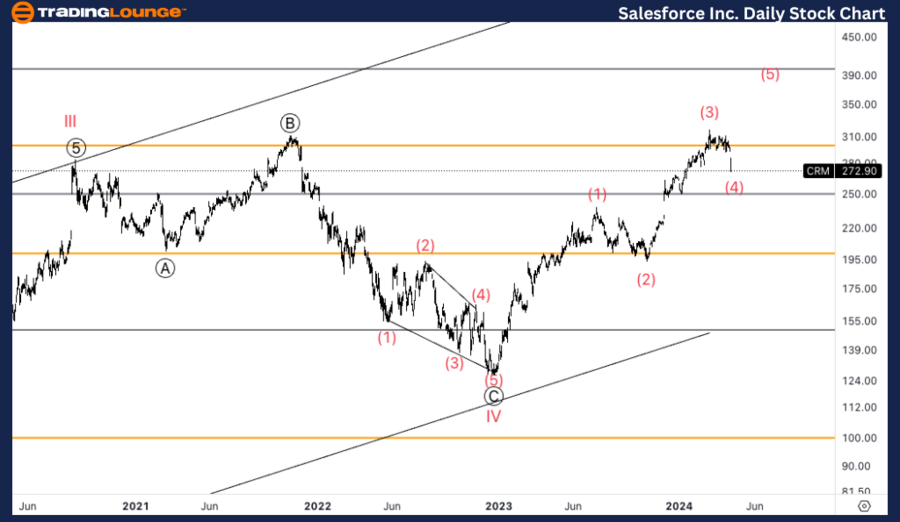
CRM Elliott Wave Analysis Trading Lounge Daily Chart,
Salesforce Inc., (CRM) Daily Chart.
CRM Elliott Wave technical analysis
Function: Counter Trend.
Mode: Corrective.
Structure: Flat.
Position: Intermediate wave (4).
Direction: Bottom in wave (4).
Details: We are reacting off TL3 at 300$, in what we labelled as wave (3) of Primary 1. We experienced a long term correction in wave IV which appears to be complete, and we are now looking for continuation higher.
Here's the latest on Salesforce Inc. (CRM) from our Elliott Wave Analysis Trading Lounge, examining both the daily and 4-hour chart.
CRM Elliott Wave technical analysis – Daily chart
Salesforce is currently exhibiting behavior typical of a counter trend phase with a corrective mode and flat structure, positioned in Intermediate wave (4). The direction is indicating a potential bottom in wave (4). We've observed a reaction off the key level, TL3 at $300, which we have identified as wave (3) of Primary 1. Following a prolonged correction in wave IV, which now appears complete, the outlook suggests a potential continuation higher.
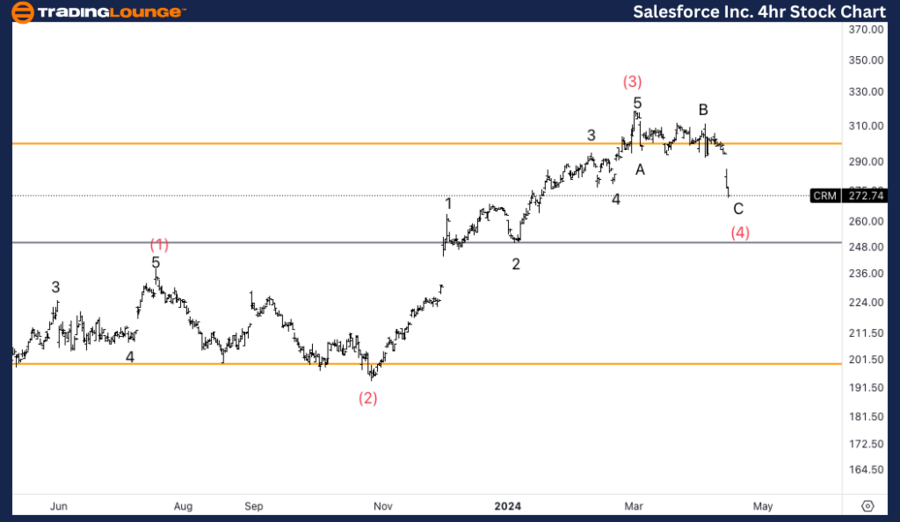
CRM Elliott Wave Analysis Trading Lounge 4Hr Chart,
Salesforce Inc., (CRM) 4H Chart.
CRM Elliott Wave technical analysis
Function: Counter Trend.
Mode: Corrective.
Structure: Flat.
Position: Wave C of (4).
Direction: Bottom in wave C.
Details: We seem to have a three wave move so far in wave (4), with a sideways wave B which because of its characteristics it gives us additional confidence we could be in a corrective structure.
CRM Elliott Wave technical analysis – Four-hour chart
The 4-hour chart further supports the daily findings but focuses on the specifics of the ongoing correction in Wave C of (4). This phase is also characterized as counter trend, corrective, and flat. The chart shows a three-wave structure for wave (4), with a sideways wave B. The nature of wave B provides additional confidence that we are indeed in a corrective structure, setting up expectations for a bottom in wave C.
Technical analyst: Alessio Barretta.
CRM Elliott Wave technical analysis [Video]
Author

Peter Mathers
TradingLounge
Peter Mathers started actively trading in 1982. He began his career at Hoei and Shoin, a Japanese futures trading company.


