|

Salesforce Inc. (CRM) Elliott Wave technical analysis

CRM Elliott Wave Analysis Trading Lounge Daily Chart,

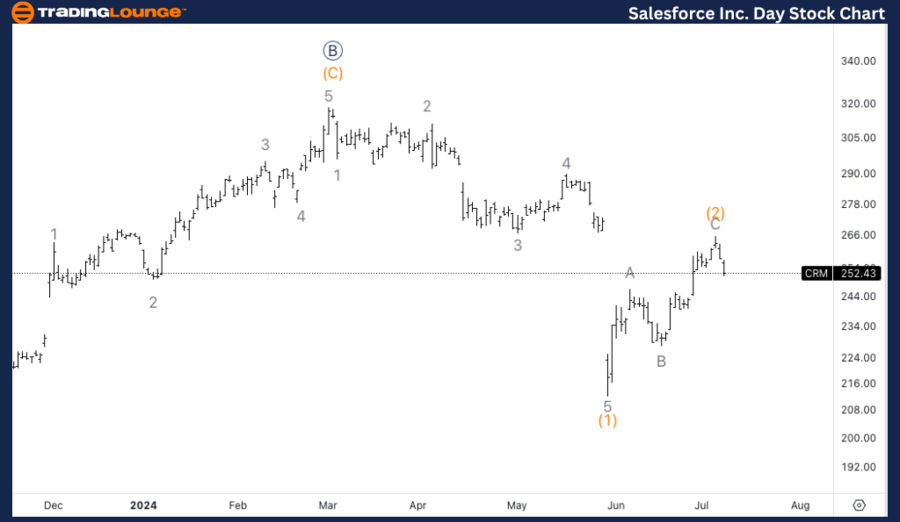
Salesforce Inc.,(CRM) Daily Chart.

CRM Elliott Wave technical analysis

Function: Trend.

Mode: Impulsive.

Structure: Motive.

Position: Primary C.  

Direction: Downside in wave (3).  

Details: Looking for a completion of Primary wave C to unfold in five waves. We could have completed a sharp wave (2) and be resuming lower. 

Chart

CRM Elliott Wave Analysis Trading Lounge 4Hr Chart,

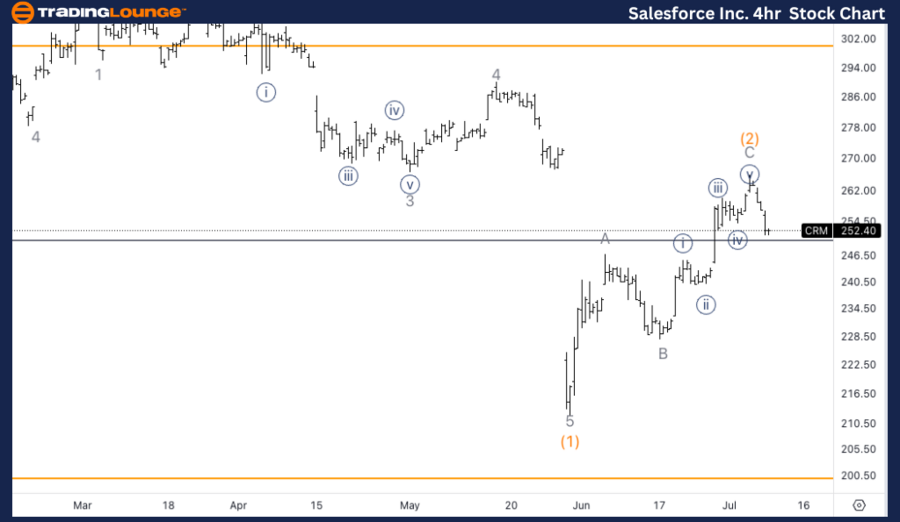
Salesforce Inc., (CRM) 4H Chart.

CRM Elliott Wave technical analysis

Function: Trend.

Mode: Impulsive.

Structure: Motive.

Position: Wave 1 of (3).

Direction: Acceleration in wave (3).

Details: We could have found a top in wave C. Looking for confirmation of further downside with a tested resistance on top of 250$. It’s possible we will double correct in wave (2), or else we could be in a wave (C) of a complex correction.

Chart

Welcome to our latest Elliott Wave analysis for Salesforce Inc. (CRM). This analysis provides an in-depth look at CRM's price movements using the Elliott Wave Theory, helping traders identify potential opportunities based on current trends and market structure. We will cover insights from both the daily and 4-hour charts to offer a comprehensive perspective on CRM's market behavior.

CRM Elliott Wave technical analysis – Daily chart

The daily chart indicates that CRM is expected to complete Primary wave C in a five-wave sequence. It appears that wave (2) was a sharp corrective wave, and the market is now resuming lower in wave (3). Traders should watch for further downside momentum as wave (3) progresses, looking for confirmation through price action and volume.

CRM Elliott Wave technical analysis – Four-hour chart

The 4-hour chart shows that CRM may have found a top in wave C, indicating the start of a new downward trend.

Technical analyst: Alessio Barretta.

CRM Elliott Wave technical analysis [Video]

Author

Peter Mathers

Peter Mathers

TradingLounge

Peter Mathers started actively trading in 1982. He began his career at Hoei and Shoin, a Japanese futures trading company.

More from Peter Mathers
Share:

Editor's Picks

EUR/USD holds firm above 1.1900 as US NFP looms

EUR/USD holds its upbeat momentum above 1.1900 in the European trading hours on Wednesday, helped by a broadly weaker US Dollar. Markets could turn cautious later in the day as the delayed US employment report for January will takes center stage. 

GBP/USD remains above nine-day EMA near 1.3650

GBP/USD recovers its recent losses from the previous session, trading around 1.3680 during the European hours on Wednesday. The technical analysis of the daily chart indicates a sustained bullish bias, as the pair trades within an ascending channel pattern.

Gold sticks to gains near $5,050 as focus shifts to US NFP

Gold holds moderate gains near the $5,050 level in the European session on Wednesday, reversing a part of the previous day's modest losses amid dovish US Federal Reserve-inspired US Dollar weakness. This, in turn, is seen as a key factor acting as a tailwind for the non-yielding yellow metal ahead of the critical US NFP release. 

US Nonfarm Payrolls expected to show modest job gains in January

The United States Bureau of Labor Statistics will release the delayed Nonfarm Payrolls data for January on Wednesday at 13:30 GMT. Investors expect NFP to rise by 70K following the 50K increase recorded in December.

S&P 500 at 7,000 is a valuation test, not a liquidity problem

The rebound from last week’s drawdown never quite shook the sense that it was being supported by borrowed conviction. The S&P 500 once again tested near the 7,000 level (6,986 as the high watermark) and failed, despite a macro backdrop that would normally be interpreted as supportive of risk.

Bitcoin price slips below $67,000 ahead of US Nonfarm Payrolls data

Bitcoin price extends losses, and trades below the lower consolidating boundary at $67,300 at the time of writing. A firm close below this level could trigger a deeper correction for BTC. Despite the weakness in price action, institutional demand shows signs of support, recording mild inflows in ETFs so far this week.