Salesforce Inc. (CRM) Elliott Wave technical analysis [Video]
![Salesforce Inc. (CRM) Elliott Wave technical analysis [Video]](https://editorial.fxstreet.com/images/Markets/Equities/SP500/wall_street_nyse2-637299021353183737_XtraLarge.jpg)
CRM Elliott Wave Analysis Trading Lounge.
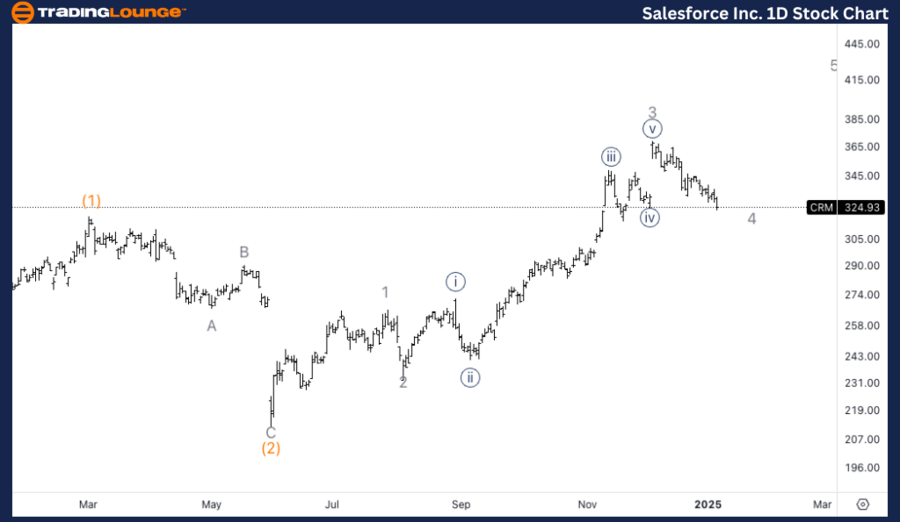
Salesforce Inc., (CRM) Daily Chart.
CRM Elliott Wave technical analysis
Function: Counter Trend.
Mode: Corrective.
Structure: Complex.
Position: Wave 4 of (3).
Direction: Pullback in 4.
Details: We are looking at a potential wave 4 near completion. It is yet unclear whether this is a wave 4 of (3) or else we are within wave 1 of. (3) suggesting much more upside potential is available.
CRM Elliott Wave technical analysis – Daily chart
Salesforce appears to be in the midst of a wave 4 pullback, which could be nearing completion. At this point, it's unclear whether this correction is part of wave 4 of (3) or if we're within the early stages of wave 1 of (3), suggesting potential for further upside. A confirmation of the wave position is necessary to clarify the next likely move. For now, expect the pullback in wave 4 to complete soon, either continuing the uptrend in wave (3) or setting up a larger bullish continuation.
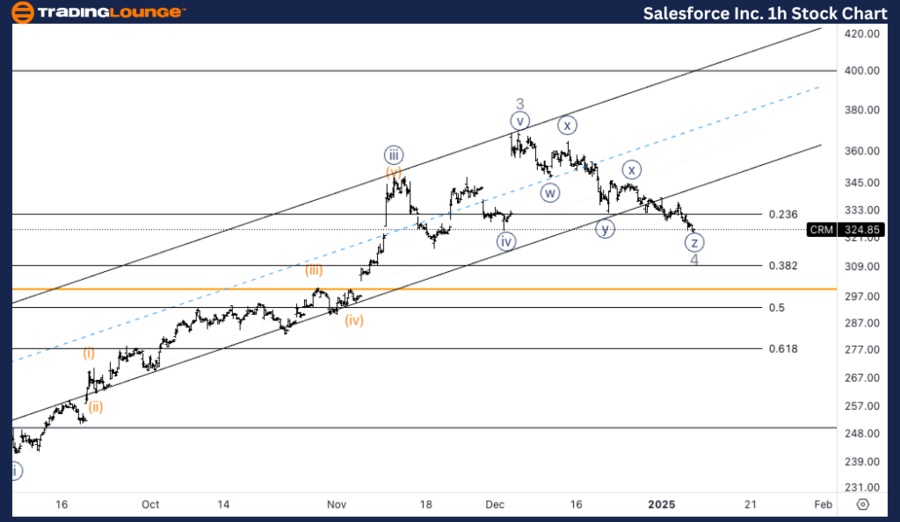
Salesforce Inc., (CRM) one-hour chart.
CRM Elliott Wave technical analysis
Function: Counter Trend
Mode: Corrective
Structure: Complex
Position: Wave {z} of 4.
Direction: Bottom in wave 4.
Detalis: We are anticipating a potential complex correction in wave 4. As we approach the area of the previous wave {iv} we could expect a bottom soon in place or else at least a pullback higher soon.
CRM Elliott Wave technical analysis – One-hour chart
The 1-hour chart suggests that wave {z} of 4 is in its final stages, indicating a possible bottom forming soon. We are approaching the area near the previous wave {iv}, which is a typical zone for the end of corrective waves. A reversal or at least a pullback higher is expected, which would confirm the completion of wave 4 and the start of a potential upward move.
This analysis focuses on the current trend structure of Salesforce Inc., (CRM) utilizing the Elliott Wave Theory on both the daily and 1-hour charts. Below is a breakdown of the stock's position and potential future movements.
Salesforce Inc. (CRM) Elliott Wave technical analysis [Video]
Author

Peter Mathers
TradingLounge
Peter Mathers started actively trading in 1982. He began his career at Hoei and Shoin, a Japanese futures trading company.


