Salesforce Inc.(CRM) Elliott Wave technical analysis [Video]
![Salesforce Inc.(CRM) Elliott Wave technical analysis [Video]](https://editorial.fxstreet.com/images/TechnicalAnalysis/ChartPatterns/PointFigure/hand-drawing-stock-chart-63151915_XtraLarge.jpg)
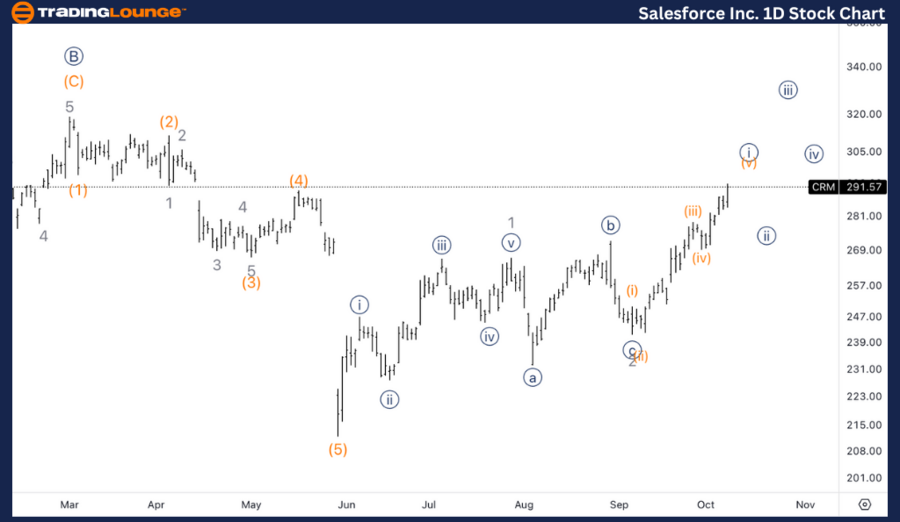
CRM Elliott Wave Analysis Trading Lounge daily chart.
CRM Elliott Wave technical analysis
Function: Trend.
Mode: Impulsive.
Structure: Motive.
Position: Minor 3.
Direction: Upside within 3.
Details: As the correction in Primary wave 4 could still no be completed, we are exploring the possibility of a running flat in 4 and consequently we could be in the early stages of a bull market.
CRM Elliott Wave technical analysis – Daily chart
On the daily chart, Salesforce (CRM) is in the third wave (Minor wave 3) of an impulsive structure. The potential for a Primary wave 4 correction to be ongoing is being explored. This suggests the possibility of a running flat correction forming in wave 4, and that CRM could be in the early stages of a new bull market. If this scenario plays out, the market could continue trending higher following this correction phase.
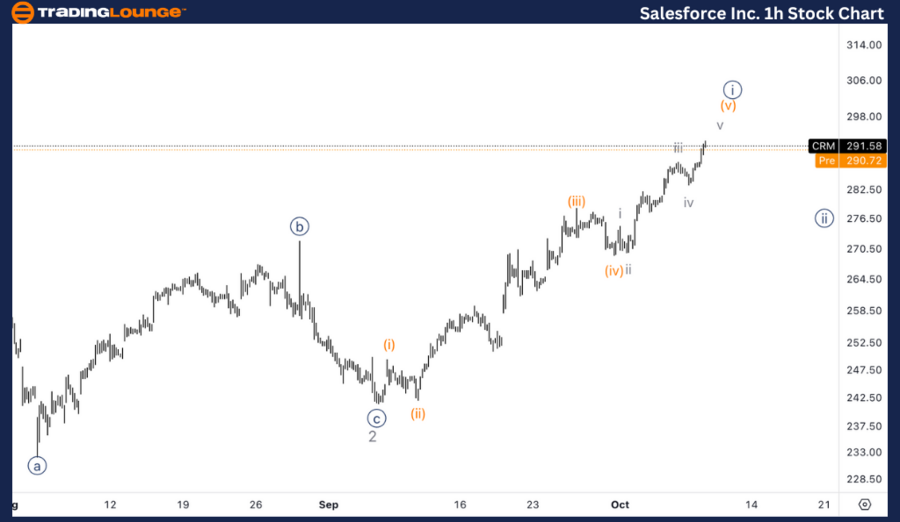
Salesforce Inc., (CRM) one-hour chart.
CRM Elliott Wave technical analysis
Function: Trend
Mode: Impulsive
Structure: Motive
Position: Wave {i} of 3.
Direction: Top in wave {i}
Details: Looking for a top in wave {i} soon in place as we seem to have a nice subdivision. It’s possible we are actually in a wave C and we will continue the overall larger correction.
CRM Elliott Wave technical analysis – One-hour chart
On the 1-hour chart, Salesforce is approaching a top in wave {i} of 3, with a clear subdivision visible in the wave structure. However, there is also the possibility that this movement is part of a wave C, meaning the larger corrective phase could still continue. The development of the current wave will confirm whether the correction is over or if more downside is expected before resuming the upward trend.
This analysis focuses on the current trend structure of Salesforce Inc., (CRM), utilizing the Elliott Wave Theory on both the daily and 1-hour charts. Below is a breakdown of the stock's position and potential future movements.
Salesforce Inc.(CRM) Elliott Wave technical analysis [Video]
Author

Peter Mathers
TradingLounge
Peter Mathers started actively trading in 1982. He began his career at Hoei and Shoin, a Japanese futures trading company.


