RUSSELL 2000 Index Elliott Wave technical analysis [Video]
![RUSSELL 2000 Index Elliott Wave technical analysis [Video]](https://editorial.fxstreet.com/images/Markets/Equities/DowJones/yahoo-finance-web-pages-on-apple-ipad-16477994_XtraLarge.jpg)
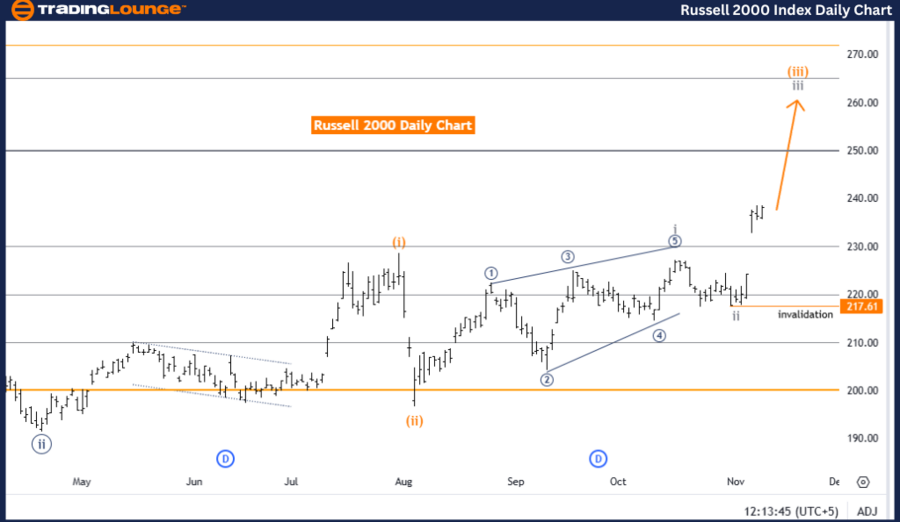
RUSSELL 2000 Elliott Wave Analysis Trading Lounge Day Chart
RUSSELL 2000 Elliott Wave technical analysis
-
Function: Trend.
-
Mode: Impulsive.
-
Structure: Gray Wave 3.
-
Position: Orange Wave 3.
-
Direction next lower degrees: Gray Wave 4.
-
Details: Gray wave 2 appears complete, with gray wave 3 currently active.
Wave cancelation invalid level: 217.61.
The Russell 2000 Day Chart, analyzed using the Elliott Wave technique, indicates a bullish trend in an impulsive mode. This trend is structured within gray wave 3, suggesting continued upward momentum. The current position, identified as orange wave 3 within the larger gray wave sequence, reinforces expectations of further gains in line with this bullish movement.
The completion of gray wave 2 sets the stage for gray wave 3, which is now in progress. This configuration aligns with the Elliott Wave principle, which typically features impulsive waves driving trends forward through structured cycles.
The next anticipated phase is gray wave 4, a corrective phase expected to follow the completion of gray wave 3. Until then, the upward trajectory of the trend is expected to persist.
Key level:
The wave invalidation level for this analysis is 217.61. A decline below this level would invalidate the current wave structure and necessitate a reevaluation of the trend's direction. Remaining above 217.61, however, supports the validity of the current bullish interpretation and suggests continued upward movement.
Conclusion:
The Russell 2000 Day Chart, based on Elliott Wave analysis, reflects a bullish outlook characterized by an active gray wave 3 in an impulsive mode. The wave sequence suggests further gains, with 217.61 serving as a critical invalidation level for the current structure. As long as the index stays above this level, the primary expectation is for sustained upward momentum within the Elliott Wave framework.
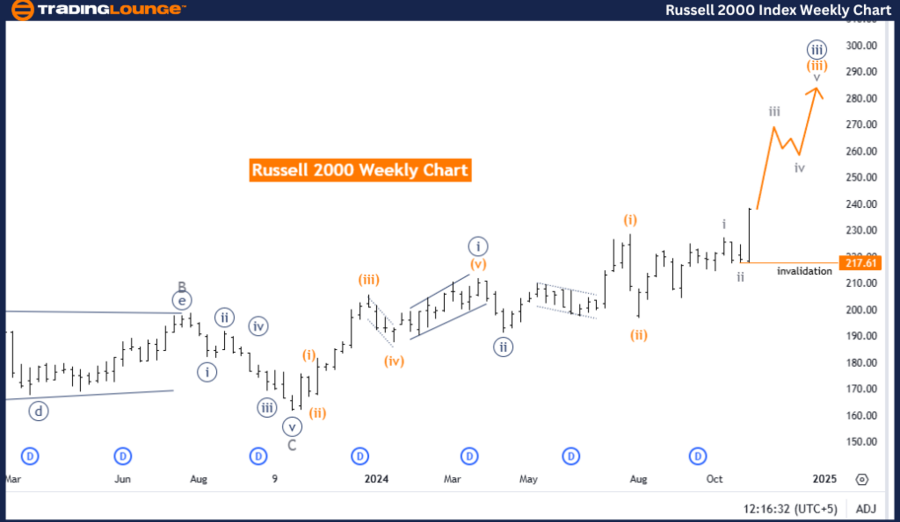
RUSSELL 2000 Elliott Wave Analysis Trading Lounge Weekly Chart
RUSSELL 2000 Elliott Wave technical analysis
-
Function: Trend.
-
Mode: Impulsive.
-
Structure: Orange Wave 3.
-
Position: Navy Blue Wave 3.
-
Direction next lower degrees: Orange Wave 4.
-
Details: Orange wave 2 seems complete, with orange wave 3 currently active.
Wave cancelation invalid level: 217.61.
The Russell 2000 Weekly Chart, interpreted through Elliott Wave analysis, highlights a bullish trend progressing in an impulsive mode. This wave structure focuses on orange wave 3, reflecting strong continuation within the current trend cycle. With orange wave 2 likely completed, orange wave 3 is now in play, suggesting further upward movement in line with the bullish outlook.
The chart’s current position aligns with navy blue wave 3, which drives the broader orange wave 3 structure. According to Elliott Wave principles, the third wave in a five-wave impulsive sequence is often the most powerful, signifying robust upward momentum and strength in the prevailing trend.
The next anticipated phase in the wave sequence is orange wave 4, which represents a potential corrective movement following the completion of orange wave 3. Until orange wave 3 concludes, the market is expected to maintain its bullish trajectory.
Key level:
A wave invalidation level is set at 217.61. A decline below this threshold would invalidate the current wave count and necessitate a reassessment of the trend. Conversely, staying above 217.61 supports the bullish wave configuration and further upward movement.
Conclusion:
The Russell 2000 Weekly Chart reflects a bullish trend led by orange wave 3 within an impulsive mode, with navy blue wave 3 driving the structure. The analysis anticipates continued strength in the index, with 217.61 serving as the critical invalidation level for the current wave count. This setup points to ongoing bullish momentum, with future analysis contingent upon the completion of orange wave 3 before transitioning to the corrective orange wave 4 phase.
Technical analyst: Malik Awais.
RUSSELL 2000 Elliott Wave technical analysis [Video]
Author

Peter Mathers
TradingLounge
Peter Mathers started actively trading in 1982. He began his career at Hoei and Shoin, a Japanese futures trading company.


