RUSSELL 2000 index Elliott Wave technical analysis [Video]
![RUSSELL 2000 index Elliott Wave technical analysis [Video]](https://editorial.fxstreet.com/images/Markets/Equities/display-stock-market-charts-23026797_XtraLarge.jpg)
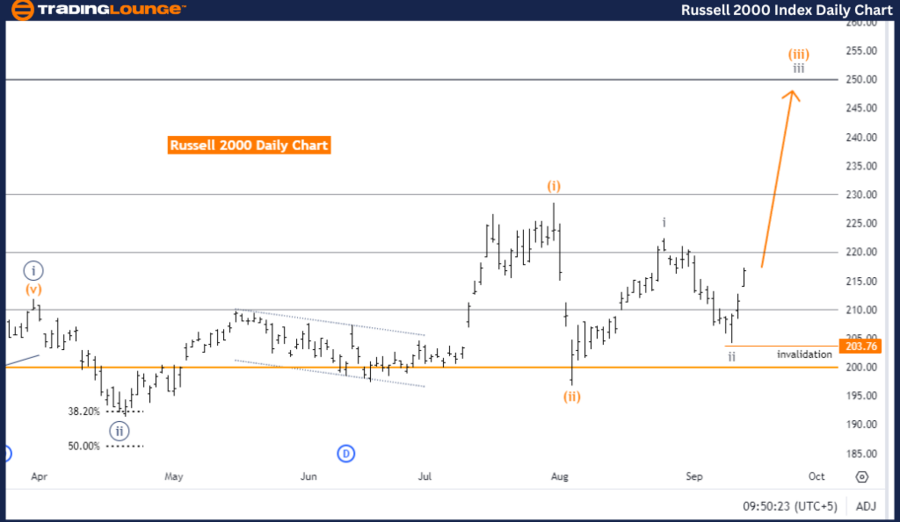
RUSSELL 2000 Elliott Wave Analysis - Trading Lounge Day Chart.
RUSSELL 2000 Elliott Wave technical analysis
Function: Trend.
Mode: Impulsive.
Structure: Gray wave 3.
Position: Orange wave 3.
Direction next higher degrees: Gray wave 3 (in progress).
Details: Gray wave 2 appears to be completed, and now gray wave 3 is active.
Wave cancel invalid level: 203.76.
The Russell 2000 Elliott Wave analysis on the daily chart shows the market currently in an impulsive trend mode, indicating strong directional movement. The wave structure being analyzed is gray wave 3, which suggests the market is in the third and typically most dynamic phase of the Elliott Wave cycle. This phase usually follows a corrective wave and is characterized by strong price momentum.
According to the analysis, gray wave 2 has completed, and gray wave 3 is now in progress. The positioning of orange wave 3 within the overall wave structure reinforces that the market is currently in an impulsive trend. This alignment of wave 3 at both the gray and orange levels signals that the upward movement is expected to continue with significant strength.
The next higher degree wave direction is also gray wave 3, further supporting the overall bullish trend in the market. When multiple wave degrees are aligned in the same direction, it typically increases confidence in the continuation of the trend. Gray wave 3 is often considered one of the strongest waves in the Elliott Wave sequence, indicating that the market could see further upward movement.
The analysis highlights a wave cancellation invalidation level at 203.76. This threshold is critical; if the market falls below this level, it would invalidate the current wave count, suggesting the anticipated impulsive move may not occur as projected.
In summary, the Russell 2000 is in an impulsive trend on the daily chart, with gray wave 3 in progress following the completion of gray wave 2. The market is expected to continue moving upward unless the invalidation level of 203.76 is breached.
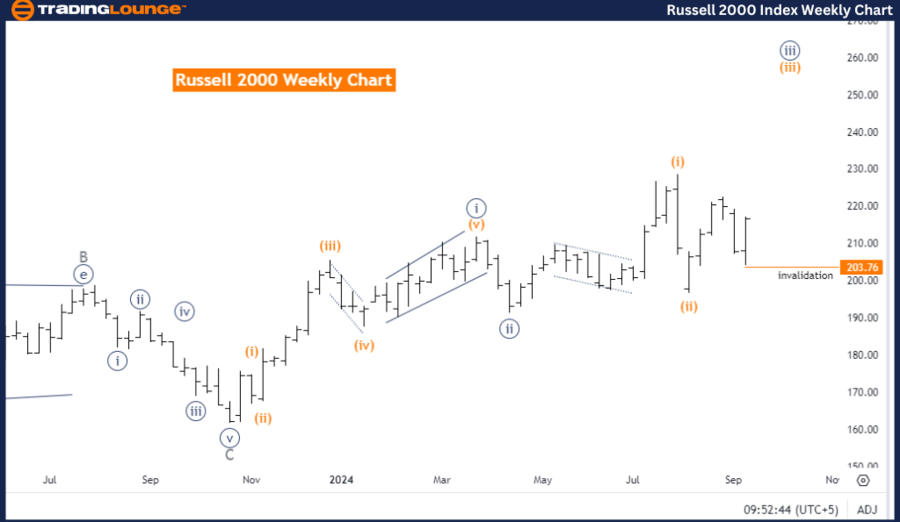
RUSSELL 2000 Elliott Wave technical analysis
Function: Trend.
Mode: Impulsive.
Structure: Orange wave 3.
Position: Navy Blue Wave 3.
Direction next higher degrees: Orange wave 3 (in progress).
Details: Orange wave 2 appears to be completed, and now orange wave 3 is active.
Wave cancel invalid level: 203.76.
The Russell 2000 Elliott Wave analysis on the weekly chart suggests the market is currently in an impulsive trend, indicating strong directional movement. The current wave structure being analyzed is orange wave 3, which is typically a powerful and extended phase in the Elliott Wave cycle, often reflecting the continuation of the overall trend. This structure follows the completion of orange wave 2, which was a corrective phase.
The analysis shows that orange wave 3 has already started, meaning the market is likely to experience upward momentum in line with the impulsive nature of this wave. The position within this broader wave structure is navy blue wave 3, which is a subwave within orange wave 3. This confirms that the upward trend is strong and in progress.
The next higher degree wave direction is also orange wave 3, indicating a continuation of the impulsive movement at multiple levels. This alignment of wave counts across different degrees reinforces the probability of further market gains and a sustained bullish trend. When wave counts are aligned in the same direction across different degrees, it usually signals a robust and reliable trend.
The analysis specifies a wave cancel invalidation level at 203.76. This level is critical because if the market falls below this point, the current Elliott Wave count would be invalidated, possibly signaling a reversal or shift in the market's anticipated direction.
In summary, the Russell 2000 weekly chart shows an impulsive trend with orange wave 3 in progress following the completion of orange wave 2. The upward momentum is expected to continue unless the market breaches the invalidation level of 203.76.
Technical analyst: Malik Awais.
RUSSELL 2000 Elliott Wave technical analysis [Video]
Author

Peter Mathers
TradingLounge
Peter Mathers started actively trading in 1982. He began his career at Hoei and Shoin, a Japanese futures trading company.


