Russell 2000 Elliott Wave technical analysis [Video]
![Russell 2000 Elliott Wave technical analysis [Video]](https://editorial.fxstreet.com/images/Markets/Equities/Industries/Food/someone-smoking-637322928607082303_XtraLarge.jpg)
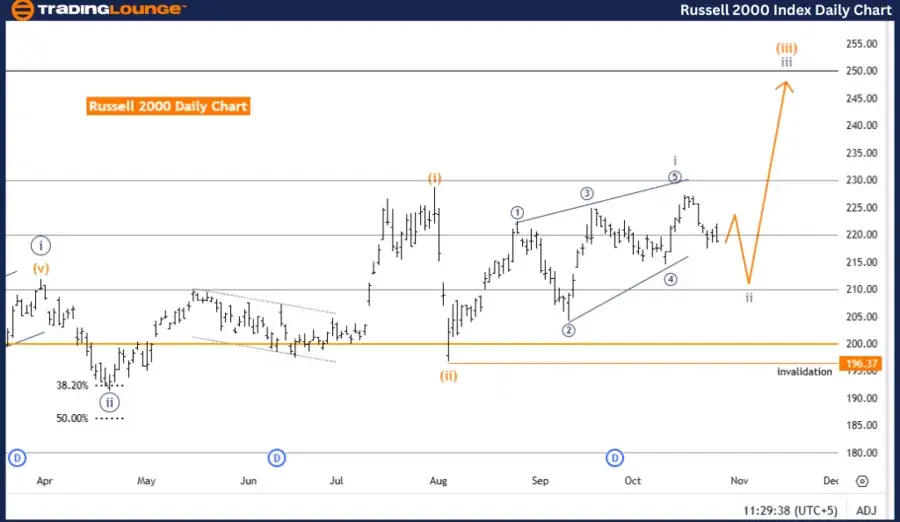
Russell 2000 Elliott Wave Analysis - Daily Chart.
Index: Russell 2000 Chart Type: Daily Chart.
Russell 2000 Elliott Wave technical analysis
-
Function: Counter Trend.
-
Mode: Corrective.
-
Structure: Gray Wave 2.
-
Position: Orange Wave 3.
-
Direction next higher degrees: Gray Wave 3.
Details:
The daily Elliott Wave analysis for the Russell 2000 index reveals a counter-trend structure with a corrective mode in gray wave 2, currently unfolding within the broader gray wave 3 structure. This setup indicates a retracement phase rather than a continuation of the primary trend. The completion of gray wave 1 has paved the way for the corrective gray wave 2, which is underway and may temporarily pause the upward momentum before the trend resumes with gray wave 3.
Gray Wave 2’s role in the sequence
As gray wave 2 progresses, it acts as a corrective pullback, suggesting that upon its conclusion, the index may resume its broader upward trend in gray wave 3. In Elliott Wave theory, wave 2 often represents a rebalancing or consolidation phase in the market, setting the stage for the next upward move after completing the correction.
Wave cancellation level
The key wave cancellation level is set at 196.37. Breaching this threshold would invalidate the current corrective structure and require a reassessment of the Elliott Wave count for the Russell 2000. So long as this level remains unbroken, the corrective wave setup remains intact, with gray wave 2 likely to transition into gray wave 3 once the pullback phase is complete.
Summary
The Russell 2000 daily chart presents a corrective pattern in gray wave 2, following the completion of gray wave 1 and preparing for gray wave 3. This phase suggests a temporary retracement within the broader trend, with 196.37 serving as a critical confirmation level for the wave structure. Once gray wave 2 completes, an upward transition to gray wave 3 is anticipated.
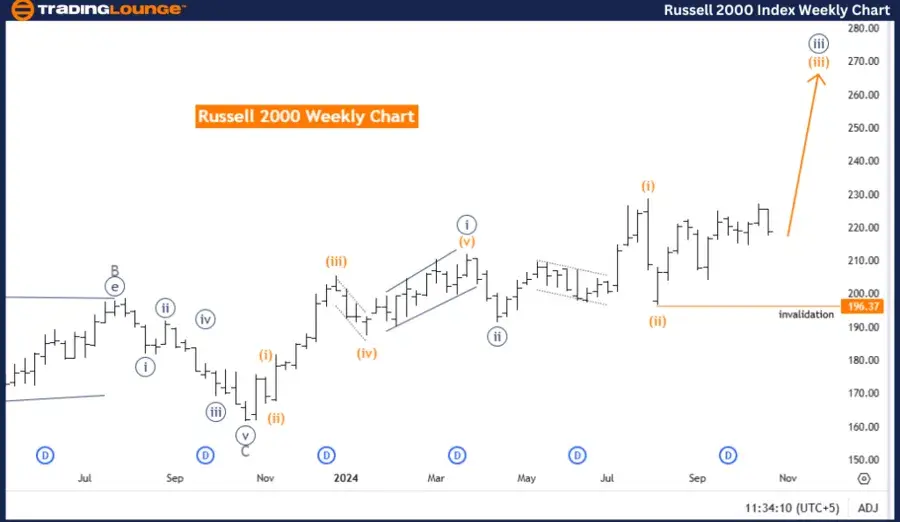
Russell 2000 Elliott Wave Analysis - Weekly Chart
Index: Russell 2000 Chart Type: Weekly Chart
Russell 2000 Elliott Wave Technical Analysis
-
Function: Trend.
-
Mode: Impulsive.
-
Structure: Orange Wave 3.
-
Position: Navy Blue Wave 3.
-
Diretion next lower degrees: Orange Wave 4.
Details:
The weekly Elliott Wave analysis of the Russell 2000 index highlights a trend-based, impulsive structure with orange wave 3 actively progressing. Positioned within navy blue wave 3, this movement reflects an upward trend, where orange wave 3 has taken over following the completion of orange wave 2. In Elliott Wave theory, an impulsive wave like wave 3 often represents the most extended and dynamic phase, characterized by increased momentum and sustained upward growth.
Progression of Orange Wave three
With orange wave 2 completed, orange wave 3 now marks the continuation of the broader trend, favoring upward movement. As orange wave 3 develops, it supports the potential for an extended bullish phase within navy blue wave 3. This structure aligns with the overall upward trend, indicating a market environment conducive to continued growth as wave 3 expands.
Wave cancellation level
The cancellation level for this impulsive wave structure is set at 196.37. If the index dips below this level, it would invalidate the current wave structure, requiring a re-evaluation of the Elliott Wave count and possibly suggesting a shift in trend interpretation. As long as the index remains above 196.37, the impulsive structure remains valid, with orange wave 3 anticipated to advance further upward.
Summary
The Russell 2000 weekly chart analysis shows an impulsive pattern with orange wave 3 progressing within navy blue wave 3, supporting further upward momentum. This trend is backed by the completion of orange wave 2 and the onset of orange wave 3. The 196.37 level is crucial for confirming the trend's validity, with expectations of sustained growth within this wave structure as long as prices remain above this key point.
Technical analyst: Malik Awais.
Russell 2000 Elliott Wave technical analysis [Video]
Author

Peter Mathers
TradingLounge
Peter Mathers started actively trading in 1982. He began his career at Hoei and Shoin, a Japanese futures trading company.


