|

Robinhood (NASDAQ: HOOD) extension in Wave III above $50

Since our previous blog about Robinhood stock HOOD, the price tripled during a strong bullish upside move. Therefore, we’ll be looking at the daily Elliott Wave Structure and explain the current structure within the cycle.

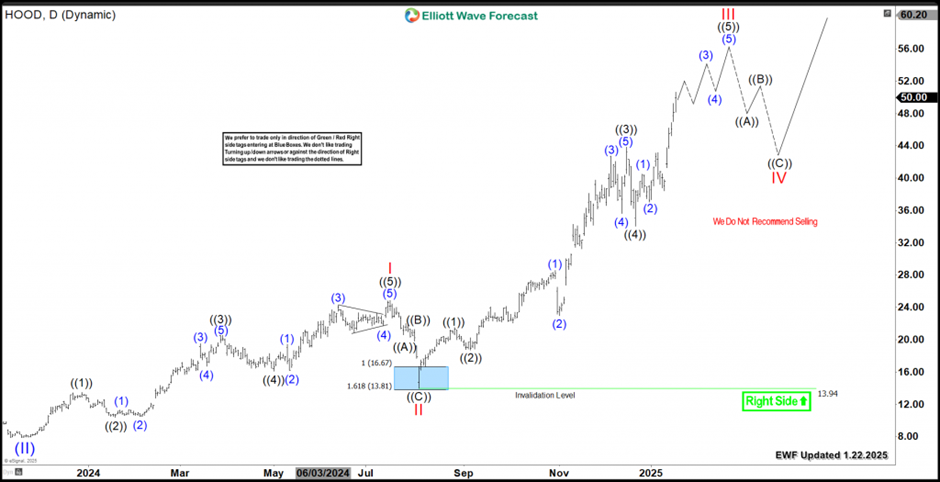
The recent daily rally started in August 2024, HOOD established an impulsive 5 waves structure to the upside within wave III. In addition, it exceeded the 1.618 Fibonacci extension level $41 which confirmed the strong momentum within the 3rd wave. The current advance from 12/20/2024 low is proposed to be wave ((5)) of III as long as it’s holding the divergence in RSI. Consequently, the stock will be looking for more upside to finish a series of 3rd & 4th waves toward $52 – $56 before ending that cycle.

HOOD still has the potential of opening more upside above if the structure turns out to be a nest. In that case, the current move will be wave ((3)) of III and it will reach equal legs area at $63 – $82. In conclusion, we don’t recommend selling the stock as the overall structure for remains bullish and we only favor buying the daily pullbacks in 3 , 7 or 11 swings.

HOOD daily chart 1.22.2025

Chart

Author

Elliott Wave Forecast Team

Elliott Wave Forecast Team

ElliottWave-Forecast.com

More from Elliott Wave Forecast Team
Share:

Editor's Picks

EUR/USD risks a deeper drop below 1.1750

EUR/USD keeps its vacillating mood in place as the the NA session drwas to a close on Tuesday, hovering below the 1.1800 hurdle amid acceptable gains in the US Dollar. In the meantime, market participants and the FX galaxy are expected to closely follow President Trump’s SOTU speech around 2AM GMT.
 

GBP/USD regains 1.3500 and above

GBP/USD extends its advance for the third day in a row on Tuesday, this time retesting the area beyond the 1.3500 hurdle. Cable’s uptick comes despite decent gains in the Greenback and the dovish message from the BoE’s Bailey at the UK Parliament.

Gold appears offered around $5,150

Gold is giving back a good portion of the recent multi-day rally, receding to the $5,150 zone per troy ounce amid the decent bounce in the US Dollar and mixed US Treasuty yields. In the meantime, markets’ attention remain on upcoming comments from Fed speakers.

Ripple’s DeFi shift in focus: Navigating XRPL EVM sidechain growth, XRPFi migration and liquidity
Ripple (XRP) has continued to trade under pressure, extending its decline by approximately 63% from the record high of $3.66 in July. The remittance token is trading above support at $1.35, while its upside appears limited by key supply zones, starting with $1.40, at the time of writing on Tuesday.
The Citrini report: How a debatable AI narrative can shake Wall Street

That AI-related headline alone was enough to rattle investors.US stocks slid sharply on Monday after a widely circulated Citrini Research memo outlined a hypothetical “2028 Global Intelligence Crisis”, warning that rapid AI adoption could push US unemployment into double digits as early as by mid-2028.

XRP pressured by weak ETF flows and declining retail interest

Ripple (XRP) is edging lower, trading above its intraday low of $1.32 at the time of writing on Tuesday. The decline from its weekly opening of $1.39 reflects heightened volatility in the broader cryptocurrency market, accentuated by tariff-triggered uncertainty.