|

Rio Tinto Limited Elliott Wave technical forecast [Video]

ASX: RIO Elliott Wave technical analysis

Our Elliott Wave analysis today focuses on RIO TINTO LIMITED - RIO, listed on the Australian Stock Exchange (ASX).

We foresee RIO potentially continuing to decline with wave 2 (grey), followed by wave 3 (grey) which may see a subsequent upward push.

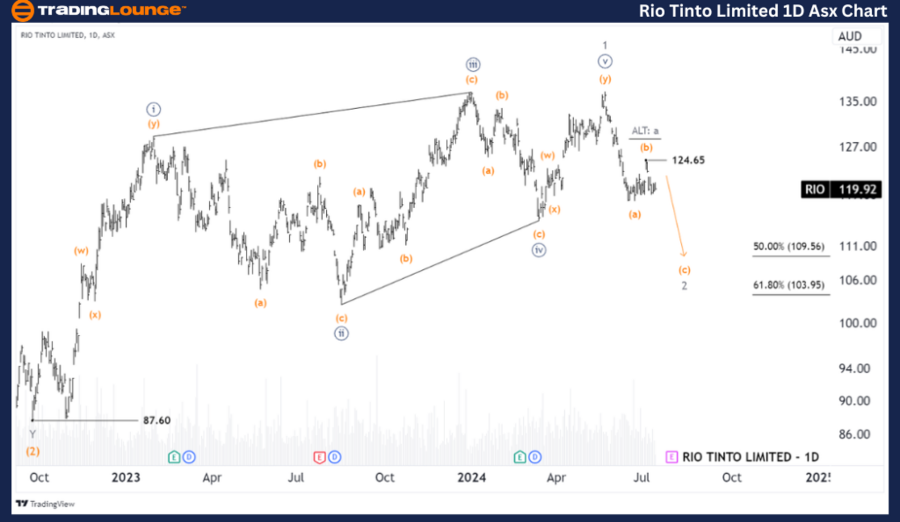
ASX: RIO one-day chart (semilog scale) analysis

  • Function: Major trend (Minor degree, grey).

  • Mode: Motive.

  • Structure: Impulse.

  • Position: Wave (c) - orange of Wave 2 - grey.

  • Details: Wave (b) - orange seems to have peaked at 124.65, with wave (c) - orange now moving lower. To maintain this outlook, the price must stay below 124.65.

  • Invalidation point: 87.60.

RIO

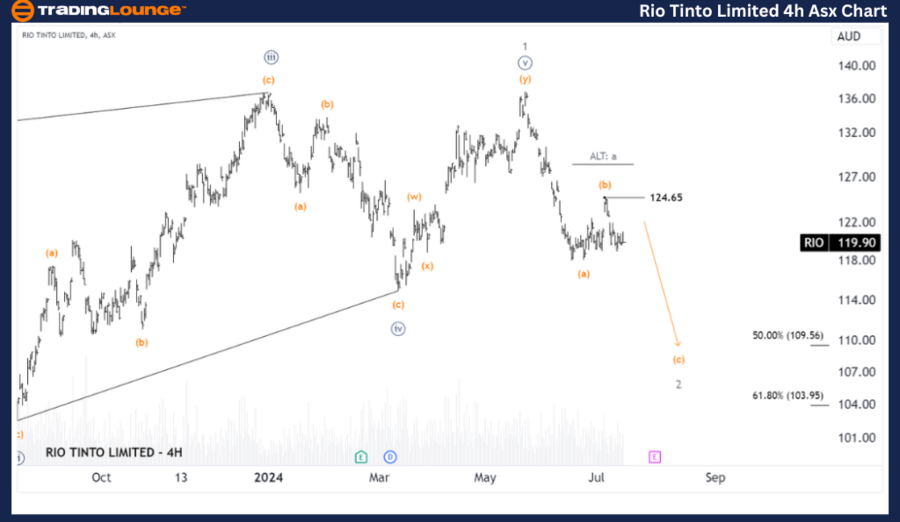
ASX: RIO four-hour chart

  • Function: Counter trend (Minute degree, navy).

  • Mode: Corrective.

  • Structure: Zigzag.

  • Position: Wave (c) - orange of Wave 2 - grey.

  • Details: Wave 2 - grey is likely to push lower, subdividing into wave (b) - orange which has peaked at 124.65. Now, wave (c) - orange is expected to decline further, with a target price of 109.56, provided the price remains below 124.65.

  • Invalidation point: 124.36.

RIO

Our analysis of ASX: RIO TINTO LIMITED - RIO provides insights into current market trends and strategies to capitalize on them effectively. We specify key price points that serve as validation or invalidation signals for our wave count, thereby enhancing confidence in our perspective. By combining these elements, we aim to offer a professional and objective view of market trends.

Rio Tinto Limited Elliott Wave technical forecast [Video]

Author

Peter Mathers

Peter Mathers

TradingLounge

Peter Mathers started actively trading in 1982. He began his career at Hoei and Shoin, a Japanese futures trading company.

More from Peter Mathers
Share:

Editor's Picks

EUR/USD stays defensive below 1.1900 as USD recovers

EUR/USD trades in negative territory for the third consecutive day, below 1.1900 in the European session on Thursday. A modest rebound in the US Dollar is weighing on the pair, despite an upbeat market mood. Traders keep an eye on the US weekly Initial Jobless Claims data for further trading impetus. 

GBP/USD holds above 1.3600 after UK data dump

\GBP/USD moves little while holding above 1.3600 in the European session on Thursday, following the release of the UK Q4 preliminary GDP, which showed a 0.1% growth against a 0.2% increase expected. The UK industrial sector activity deteriorated in Decembert, keeping the downward pressure intact on the Pound Sterling. 

Gold sticks to modest intraday losses as reduced March Fed rate cut bets underpin USD

Gold languishes near the lower end of its daily range heading into the European session on Thursday. The precious metal, however, lacks follow-through selling amid mixed cues and currently trades above the $5,050 level, well within striking distance of a nearly two-week low touched the previous day.

Cardano eyes short-term rebound as derivatives sentiment improves

Cardano (ADA) is trading at $0.257 at the time of writing on Thursday, after slipping more than 4% so far this week. Derivatives sentiment improves as ADA’s funding rates turn positive alongside rising long bets among traders.

The market trades the path not the past

The payroll number did not just beat. It reset the tone. 130,000 vs. 65,000 expected, with a 35,000 whisper. 79 of 80 economists leaning the wrong way. Unemployment and underemployment are edging lower. For all the statistical fog around birth-death adjustments and seasonal quirks, the core message was unmistakable. The labour market is not cracking.

Sonic Labs’ vertical integration fuels recovery in S token

Sonic, previously Fantom (FTM), is extending its recovery trade at $0.048 at the time of writing, after rebounding by over 12% the previous day. The recovery thesis’ strengths lie in the optimism surrounding Sonic Labs’ Wednesday announcement to shift to a vertically integrated model, aimed at boosting S token utility.