RIO Stock Analysis and Elliott Wave technical forecast [Video]
![RIO Stock Analysis and Elliott Wave technical forecast [Video]](https://editorial.fxstreet.com/images/Markets/Equities/Industries/Media/Netflix_3_XtraLarge.jpg)
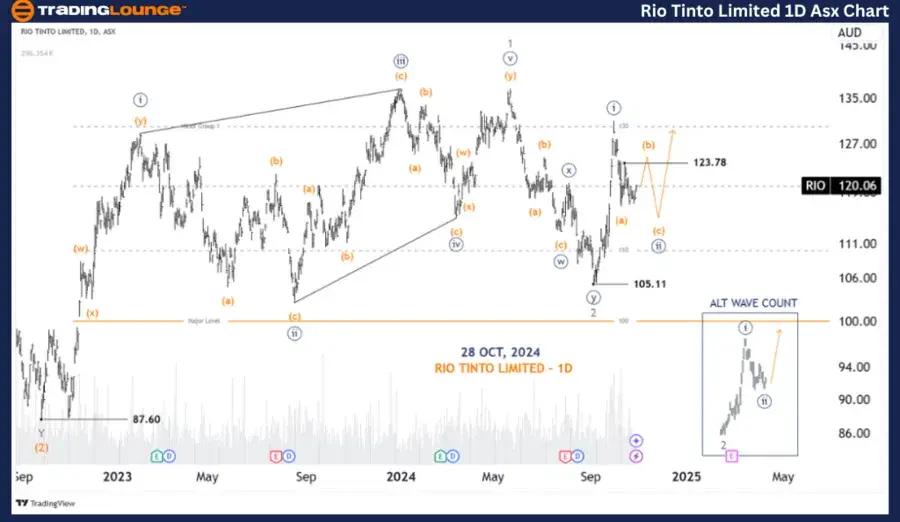
ASX: RIO TINTO LIMITED - RIO Elliott Elliott Wave Technical Analysis TradingLounge (1D Chart).
Greetings, Our Elliott Wave analysis today updates the Australian Stock Exchange (ASX) with RIO TINTO LIMITED - RIO. We see RIO possibly rallying with wave ((iii))-navy after some time, but not now as wave ((ii))-navy will probably still push lower one more time.
ASX: RIO Tinto Limited - RIO 1D chart (Semilog scale) analysis
Function: Major trend (Minor degree, grey).
Mode: Motive.
Structure: Impulse.
Position: Wave ((ii))-navy of Wave 3-grey.
Details: Wave ((ii))-navy may still have one more leg to push lower to complete the entire Zigzag pattern. Then wave ((iii))-navy may push higher. The ALT alternative scenario shows that wave ((ii))-navy has ended, and wave ((iii))-navy is unfolding, to trigger the alternative scenario, price needs to push up quickly, and strongly past the 123.78 level significantly.
Invalidation point: 105.11.
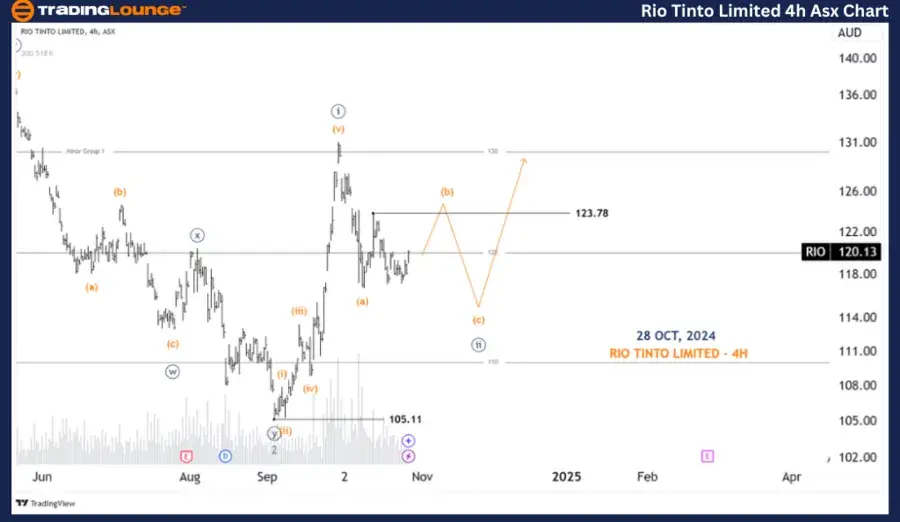
ASX: RIO Tinto Limited - RIO four-hour chart analysis
Function: Major trend (Minuette degree, navy).
Mode: Motive.
Structure: Impulse.
Position: Wave (b)-orange of Wave ((ii))-navy.
Details: Wave ((ii))-navy is unfolding to push lower as a Zigzag (a),(b),(c)-orange. I don't think it's complete yet, and wave (b)-orange is probably not finished yet, so a slight push to the upside is needed, then wave (c)-orange will continue to push lower to complete the whole wave ((ii))-navy.
Invalidation point: 105.11.
Conclusion
Our analysis, forecast of contextual trends, and short-term outlook for ASX: RIO TINTO LIMITED - RIO aim to provide readers with insights into the current market trends and how to capitalize on them effectively. We offer specific price points that act as validation or invalidation signals for our wave count, enhancing the confidence in our perspective. By combining these factors, we strive to offer readers the most objective and professional perspective on market trends.
Technical analyst: Hua (Shane) Cuong, CEWA-M (Master’s Designation).
Author

Peter Mathers
TradingLounge
Peter Mathers started actively trading in 1982. He began his career at Hoei and Shoin, a Japanese futures trading company.


