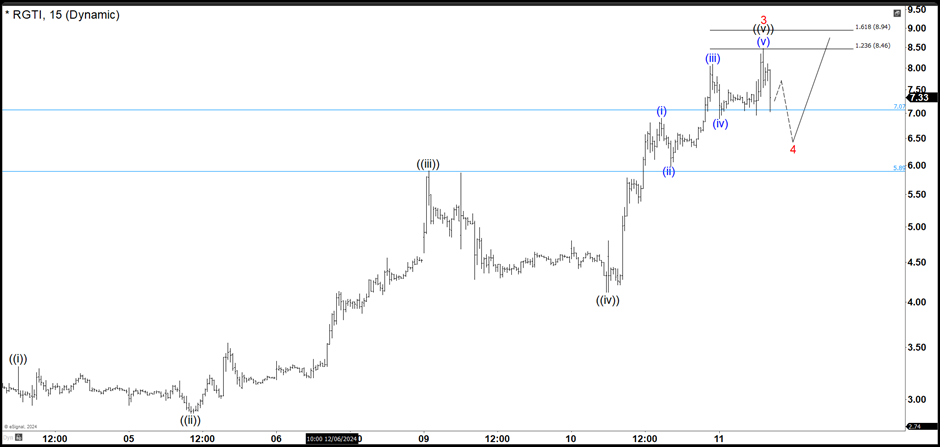
RGTI has risen rapidly in value in recent days attracting the attention of investors. Here we have the 15-minute chart. Applying the Elliott Waves principle, the stock should find support in 5.89 – 7.07 area to complete a wave 4. This would generate a new rally on wave 5 that could reach around 8.94 – 10.25 or extend higher.
RGTI 15 min chart 12.11.2024
In any case, as long as the market respects the 5.89 – 7.07 area, RGTI must continue with the upward movement and break above wave 3 to reach at least 8.94 – 10.25. If the market closes below 5.89, it would open the possibility that the value of the stock will drop to 4.00 before looking for another move higher.
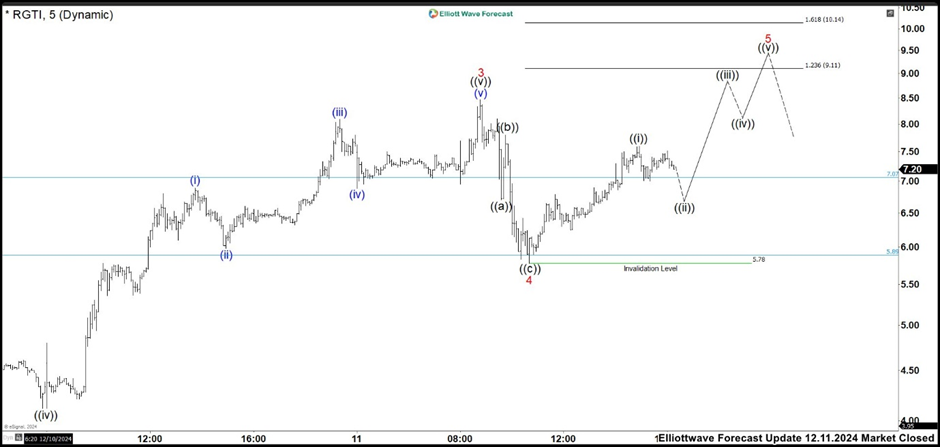
RGTI 5 min chart 12.11.2024 (market closed)
RGTI found support at 5.78 low and rallied. From here, we are looking to build an impulse structure as wave 5. Wave ((i)) could be completed already and while the pullback as wave ((ii)) is above 5.78 low, RGTI should continue higher. The target for this wave 5 comes in 9.11 -10.14 if there is not more extension in the rally.
FURTHER DISCLOSURES AND DISCLAIMER CONCERNING RISK, RESPONSIBILITY AND LIABILITY Trading in the Foreign Exchange market is a challenging opportunity where above average returns are available for educated and experienced investors who are willing to take above average risk. However, before deciding to participate in Foreign Exchange (FX) trading, you should carefully consider your investment objectives, level of xperience and risk appetite. Do not invest or trade capital you cannot afford to lose. EME PROCESSING AND CONSULTING, LLC, THEIR REPRESENTATIVES, AND ANYONE WORKING FOR OR WITHIN WWW.ELLIOTTWAVE- FORECAST.COM is not responsible for any loss from any form of distributed advice, signal, analysis, or content. Again, we fully DISCLOSE to the Subscriber base that the Service as a whole, the individual Parties, Representatives, or owners shall not be liable to any and all Subscribers for any losses or damages as a result of any action taken by the Subscriber from any trade idea or signal posted on the website(s) distributed through any form of social-media, email, the website, and/or any other electronic, written, verbal, or future form of communication . All analysis, trading signals, trading recommendations, all charts, communicated interpretations of the wave counts, and all content from any media form produced by www.Elliottwave-forecast.com and/or the Representatives are solely the opinions and best efforts of the respective author(s). In general Forex instruments are highly leveraged, and traders can lose some or all of their initial margin funds. All content provided by www.Elliottwave-forecast.com is expressed in good faith and is intended to help Subscribers succeed in the marketplace, but it is never guaranteed. There is no “holy grail” to trading or forecasting the market and we are wrong sometimes like everyone else. Please understand and accept the risk involved when making any trading and/or investment decision. UNDERSTAND that all the content we provide is protected through copyright of EME PROCESSING AND CONSULTING, LLC. It is illegal to disseminate in any form of communication any part or all of our proprietary information without specific authorization. UNDERSTAND that you also agree to not allow persons that are not PAID SUBSCRIBERS to view any of the content not released publicly. IF YOU ARE FOUND TO BE IN VIOLATION OF THESE RESTRICTIONS you or your firm (as the Subscriber) will be charged fully with no discount for one year subscription to our Premium Plus Plan at $1,799.88 for EACH person or firm who received any of our content illegally through the respected intermediary’s (Subscriber in violation of terms) channel(s) of communication.
Recommended content
Editors’ Picks

EUR/USD trims losses with Wall Street's opening, advances beyond 1.0500
EUR/USD regained its poise with Wall Street's opening, recovering from a fresh weekly low of 1.0468. The European Central Bank trimmed interest rates as expected, and the United States published discouraging employment and inflation-related data. Markets remain cautious, limiting directional strength.

GBP/USD finds near-term buyers around 1.2700
GBP/USD bounced from around the 1.2700 level in the American session, still trading in the red around 1.2730. A certain dose of caution helps the US Dollar, limiting its bearish potential against most major rivals.

Gold pierces $2,700 as investors assess US news, ECB decision
XAU/USD pierced the $2,700 threshold and remains under pressure as investors diggest US figures and the European Central Bank monetary policy announcement. Inflation in the US at wholesale levels rose by more than anticipated in November, according to the latest Producer Price Index release.
-637336005550289133_Medium.jpg)
Chainlink surges amid World Liberty purchase, Emirates NBD partnership and CCIP launch on Ronin network
Chainlink price surges around 15% on Thursday, reaching levels not seen since mid-November 2021. The rally was fueled by the Donald Trump-backed World Liberty Financial purchase of 41,335 LINK tokens worth $1 million on Thursday.

Can markets keep conquering record highs?
Equity markets are charging to new record highs, with the S&P 500 up 28% year-to-date and the NASDAQ Composite crossing the key 20,000 mark, up 34% this year. The rally is underpinned by a potent mix of drivers.

Best Forex Brokers with Low Spreads
VERIFIED Low spreads are crucial for reducing trading costs. Explore top Forex brokers offering competitive spreads and high leverage. Compare options for EUR/USD, GBP/USD, USD/JPY, and Gold.

