Resmed Inc Elliott Wave technical forecast [Video]
![Resmed Inc Elliott Wave technical forecast [Video]](https://editorial.fxstreet.com/images/i/bullish-chart_XtraLarge.png)
RMD Elliott Wave technical analysis
Greetings, Our Elliott Wave analysis today updates the Australian Stock Exchange (ASX) RESMED INC - RMD. We see that ASX:RMD is developing in an Extended Wave, and we are inside the third wave of Wave 3 - Wave ((iii))-navy of Wave 3-grey. So this stock should move much higher in the future. This analysis will provide readers with insights, key price levels to maintain this bullish view.
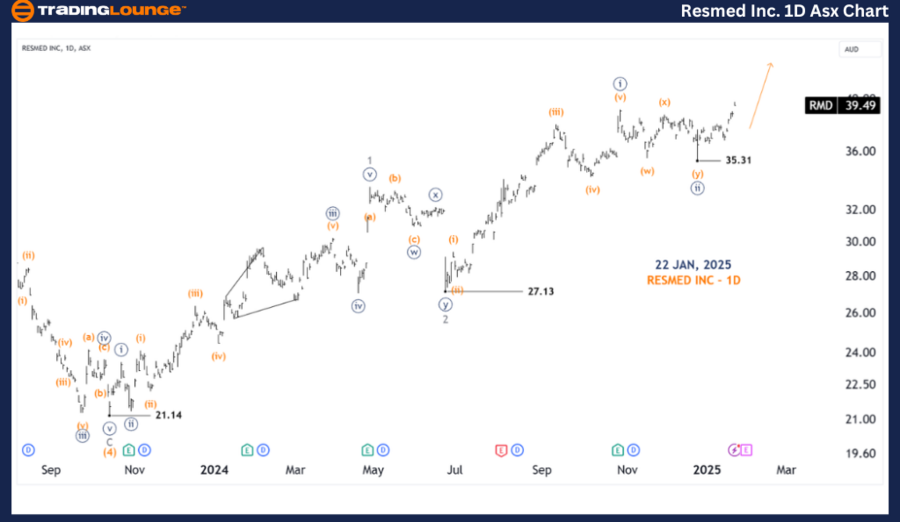
ASX: RMD one-day chart (semilog scale) analysis
Function: Major trend (Minor degree, grey).
Mode: Motive.
Structure: Impulse.
Position: Wave ((iii))-navy of Wave 3-grey.
Details: Wave 3-grey is still unfolding and developing as an Extended Wave labeled ((i))((ii))((iii))-navy. The recent price action shows that wave ((ii))-navy is completed, and wave ((iii))-navy is starting to move higher from the low of 35.31, with a projected target of 50.00.
Invalidation point: 35.31.
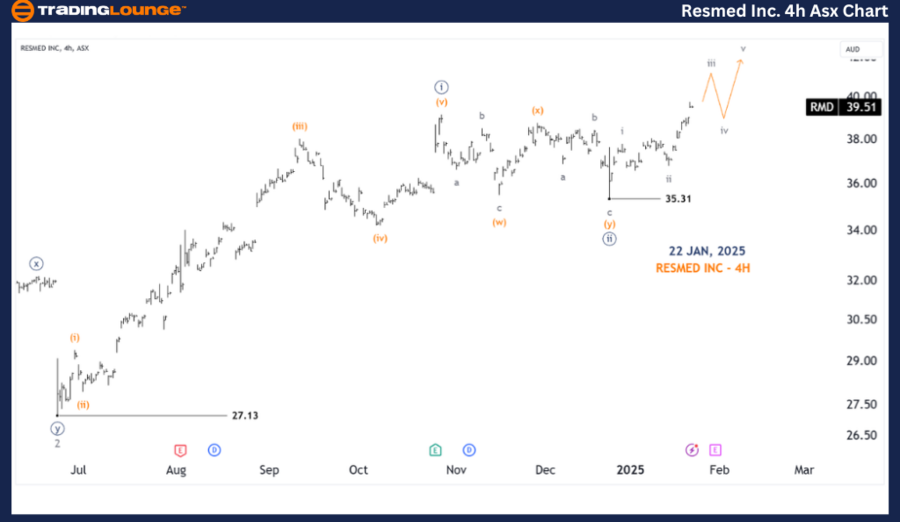
ASX: RMD four-hour chart analysis
Function: Major trend (Minute degree, navy).
Mode: Motive.
Structure: Impulse.
Position: Wave iii-grey of Wave (i)-orange of Wave ((iii))-navy.
Details: The shorter term outlook shows that since the 35.31 level wave ((iii))-navy is unfolding, it is probably completing wave (i)-orange (Not shown on the chart), and wave (i)-orange itself has subwaves i-grey to v-grey. Wave iii-grey is advancing in its role, and then there is still an advance with wave v-grey.
Invalidation point: 35.31.
Conclusion
Our analysis, forecast of contextual trends, and short-term outlook for ASX: RESMED INC - RMD aim to provide readers with insights into the current market trends and how to capitalize on them effectively. We offer specific price points that act as validation or invalidation signals for our wave count, enhancing the confidence in our perspective. By combining these factors, we strive to offer readers the most objective and professional perspective on market trends.
Resmed Inc Elliott Wave technical forecast [Video]
Author

Peter Mathers
TradingLounge
Peter Mathers started actively trading in 1982. He began his career at Hoei and Shoin, a Japanese futures trading company.


