Reliance Industries Elliott Wave technical analysis [Video]
![Reliance Industries Elliott Wave technical analysis [Video]](https://editorial.fxstreet.com/images/TechnicalAnalysis/ChartPatterns/Candlesticks/close-up-of-candlestick-stock-chart-with-pen-40815814_XtraLarge.jpg)
Reliance Industries Elliott Wave technical analysis
Function: Corrective Lower (Intermediate degree, orange.).
Mode: Corrective.
Structure: Zigzag.
Position: Minor Wave 1 Grey.
Details: Minor Wave 1 Grey potentially still unfolding with prices breaking below 2650 mark. Expect a counter trend rally to unfold Minor Wave 2 Grey soon towards 2900-50 zone, before prices turn lower again.
Invalidation point: 3220.
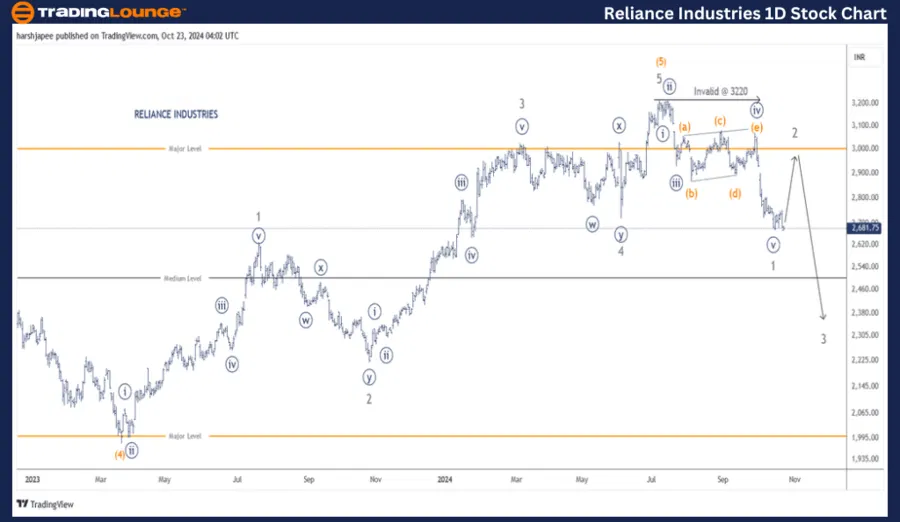
Reliance Industries daily chart technical analysis and potential Elliott Wave counts
Reliance Industry daily chart is indicating termination of a progressive rally around 3220 high, marked as Intermediate Wave (5) Orange. Furthermore, the drop towards 2650 has unfolded as an impulse confirming further downside going forward.
Also note that price action has broken below 2720, the previous Wave 4 Grey of one lesser degree. Ideally, expect a pullback from here soon before the drop resumes. In March 2023, Intermediate Wave (4) had terminated around 1980 mark.
Since then, a five wave rally can be seen through 3220 high, marked as Intermediate Wave (5); followed by a drop to 2650 levels terminating Minor Wave 1 Grey. If the above proposed counts hold well, expect Wave 2 rally to resume soon.
Reliance Industries Elliott Wave technical analysis
Function: Corrective Lower (Intermediate degree, orange.).
Mode: Corrective.
Structure: Zigzag.
Position: Minor Wave 1 Grey.
Details: Minor Wave 1 Grey potentially still unfolding with prices breaking below 2650 mark. Expect a counter trend rally to unfold Minor Wave 2 Grey soon towards 2900-50 zone, before prices turn lower again as Minor Wave 3 Grey resumes.
Invalidation point: 3220.
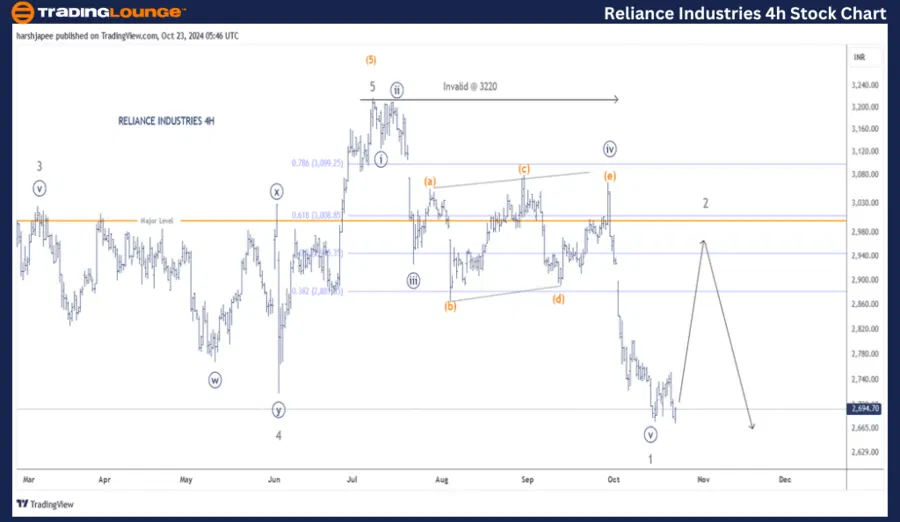
Reliance Industries four-hour chart technical analysis and potential Elliott Wave counts
Reliance Industries H chart highlights the sub waves since Minor Wave 3 Grey of the larger degree uptrend. The stock rallied through 3220 to terminate Wave 5 Grey before potentially reversing the trend. Bears have just managed to carve an impulse lower at Minute degree around 2650, also terminating Minor Wave 1. If correct, expect Wave 2 to unfold potential expanded flat) towards 2900 in the near term.
Conclusion
Reliance Industries seem to have turned lower since printing 3220 high in July 2024. The stock has completed Minor Wave 1 lower around 2650 mark and is probably unfolding Minor Wave 2 now.
Reliance Industries Elliott Wave technical analysis [Video]
Author

Peter Mathers
TradingLounge
Peter Mathers started actively trading in 1982. He began his career at Hoei and Shoin, a Japanese futures trading company.


