RCL (Royal Caribbean Group): The symbol reaches definition area [Video]
![RCL (Royal Caribbean Group): The symbol reaches definition area [Video]](https://editorial.fxstreet.com/images/TechnicalAnalysis/ChartPatterns/PointFigure/hand-drawing-stock-chart-63151915_XtraLarge.jpg)
Royal Caribean has been one of the stronger symbols in the sector. The Symbol ended the Grand Super Cycle back on 01.29.2018 and did a powerful three waves back. The pullback ended on 03.13.2020, and the stock then reacted in five waves off those lows. This suggests at that moment that more upside should happen and the upside should prevail.
RCL Weekly Elliott Wave Chart
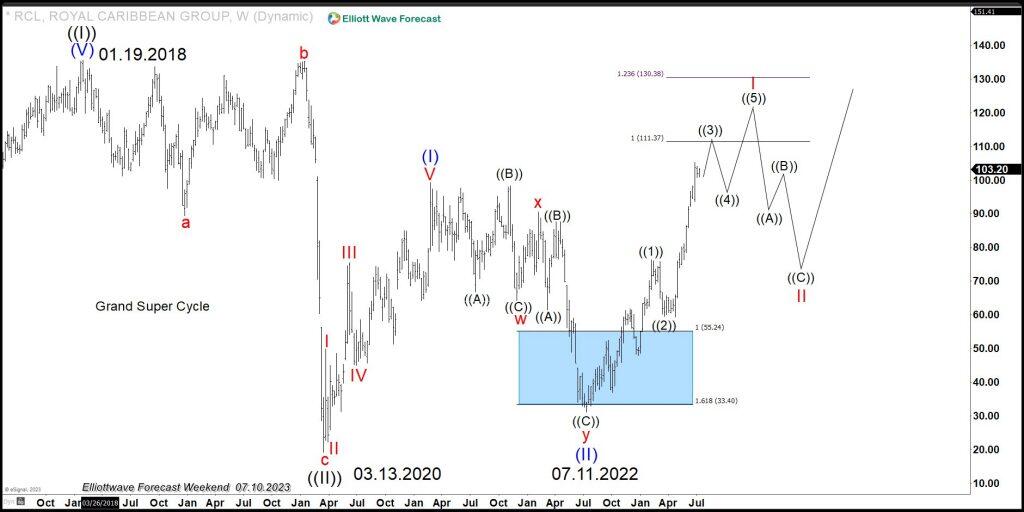
The chart above shows the expected pullback happens, and now a rally is underway. Target of the rally is $111.89-$130.90, which most likely will produce a three waves pullback. The Elliott Wave Theory states that the market corrects in three, seven, and eleven swing. As of now, as far as the stock stays below the peak on 01.19.2028, a seven swing lower still can’t be ruled out. Using correlation with the other stock and market however, a double correction in 7 swing is less likely because symbols like $CCL ( Carnival Cruise Line) does not have the room for a massive sell-off. The sell off in RCL will likely come from the 111.89-130.90 area. Below we compare CCL and RCL technical chart
CCL and RCL Corrrelation chart
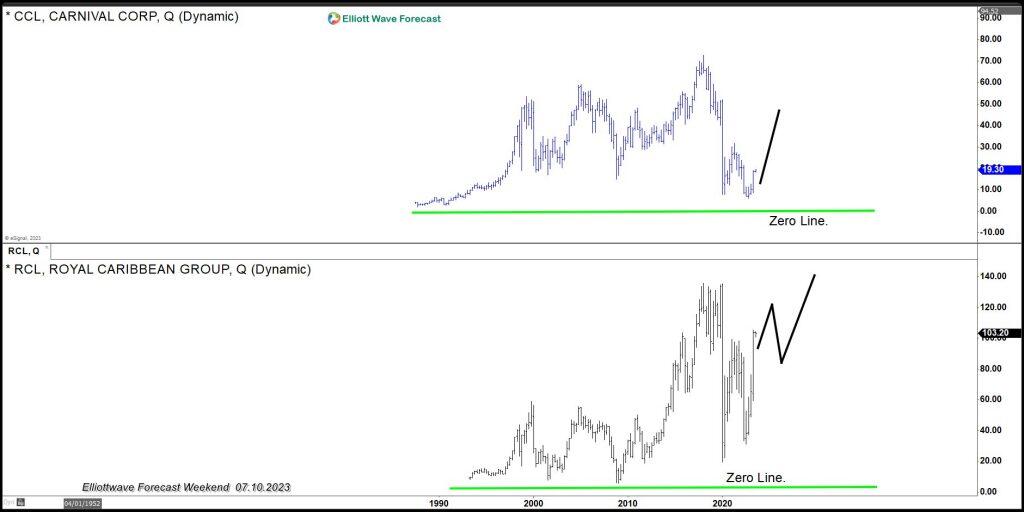
Above chart is an overlay of Royal Caribbean and Carnival Cruise Line, which shows how deep CCL pullback is compared to RCL within the Grand Super Cycle. CCL is near the zero line already and thus a huge stock selloff will take it out of business. The reality is that even when RCL can do a double correction in 7 swing lower, a major low is already in place, and the Grand Super Cycle Trend has renewed to the upside. There is no question a pullback should happen from the area, as mentioned earlier. Still, a pullback should give another opportunity to buy, allowing RCL to rally to new all-time highs.
Read the previous article about Royal Caribbean Group in which we explained the path ahead. The following video explains our view and explains why buying the dips until the $111.89 130.90 area is the proper mid cycles trades. But when the cycle since 07.11.2022 ends, then buying the next dip might be a long-term opportunity. We hope everyone can see the opportunity ahead and how technical the market is and will continue to be.
RCL Elliott Wave video
Premium
You have reached your limit of 3 free articles for this month.
Start your subscription and get access to all our original articles.
Author

Elliott Wave Forecast Team
ElliottWave-Forecast.com


