Ramsay Health Care Limited Elliott Wave analysis [Video]
![Ramsay Health Care Limited Elliott Wave analysis [Video]](https://editorial.fxstreet.com/images/Markets/Equities/Industries/HealthCare/pic-doctor-hands-637435350842016741_XtraLarge.jpg)
ASX: RHC Elliott Wave technical analysis
Greetings, Our Elliott Wave analysis today updates the Australian Stock Exchange (ASX) RAMSAY HEALTH CARE LIMITED - RHC. We see RHC.ASX continue to push lower to complete the entire corrective wave. After that, we will be back in the impulse wave to move up with the main trend.
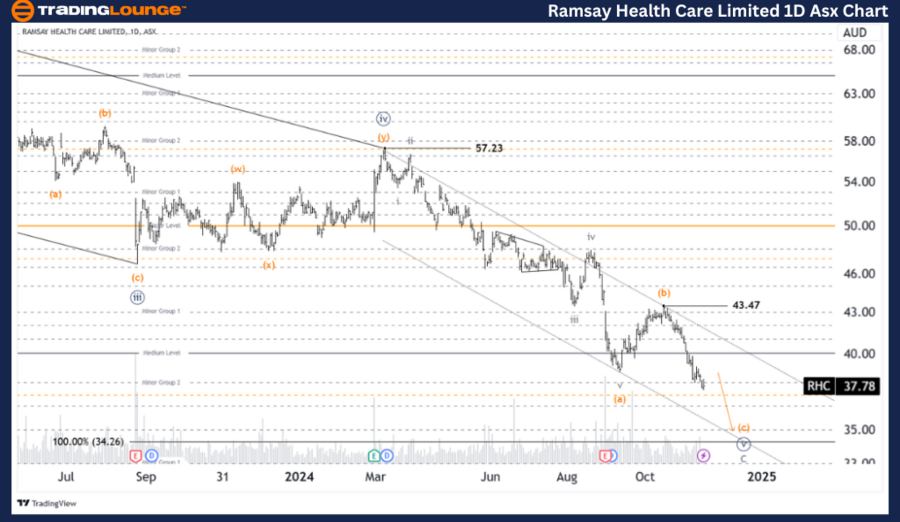
ASX: RHC one-day chart analysis
Function: Major trend (Minute degree, navy).
Mode: Motive.
Structure: Impulse.
Position: Wave (c)-orange of Wave ((v))-navy.
Details: Wave C-grey is developing as an Ending Diagonal, and its wave ((v))-navy is almost done pushing lower as a Zigzag. Wave (a),(b)-orange is complete, and wave (c)-orange is also moving a little lower.
Invalidation point: 43.47.
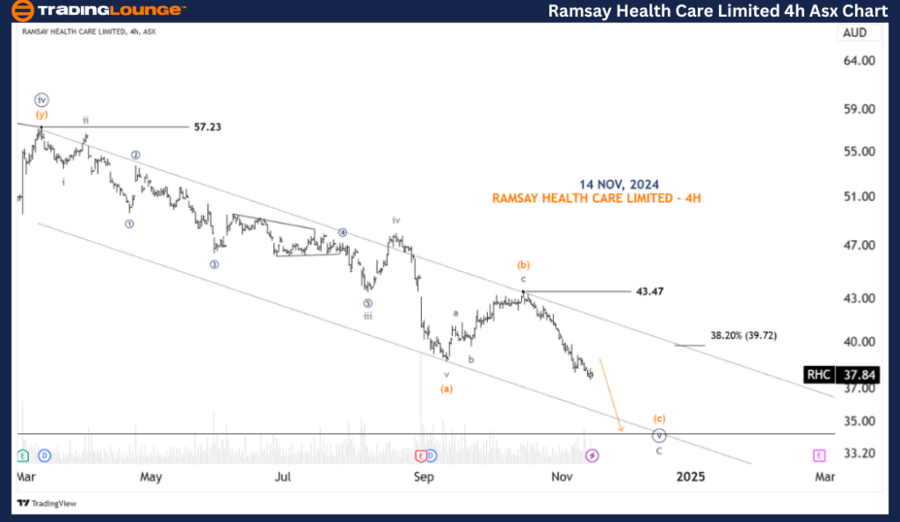
ASX: RHC four-hour chart analysis
Function: Major trend (Minor degree, grey).
Mode: Motive.
Structure: Diagonal.
Position: Wave (c)-orange of Wave ((v))-navy of Wave C-grey.
Details: The (c)-orange wave of the ((v))-navy wave of the C-grey wave is continuing to push lower. While the price must remain below 43.47 to maintain this view. On the other hand, when the price pushes above 39.72, it is a first sign that suggests that the C-grey wave may be over, and the larger impulse wave may be gradually returning to the main trend.
Invalidation point: 43.47.
Conclusion
Our analysis, forecast of contextual trends, and short-term outlook for ASX: RAMSAY HEALTH CARE LIMITED - RHC aim to provide readers with insights into the current market trends and how to capitalize on them effectively. We offer specific price points that act as validation or invalidation signals for our wave count, enhancing the confidence in our perspective. By combining these factors, we strive to offer readers the most objective and professional perspective on market trends.
Ramsay Health Care Limited Elliott Wave analysis [Video]
Author

Peter Mathers
TradingLounge
Peter Mathers started actively trading in 1982. He began his career at Hoei and Shoin, a Japanese futures trading company.


