Qualcomm Inc. (QCOM) Elliott Wave technical analysis [Video]
![Qualcomm Inc. (QCOM) Elliott Wave technical analysis [Video]](https://editorial.fxstreet.com/images/TechnicalAnalysis/ChartPatterns/Chartism/foreign-exchange-market-chart-69068965_XtraLarge.jpg)
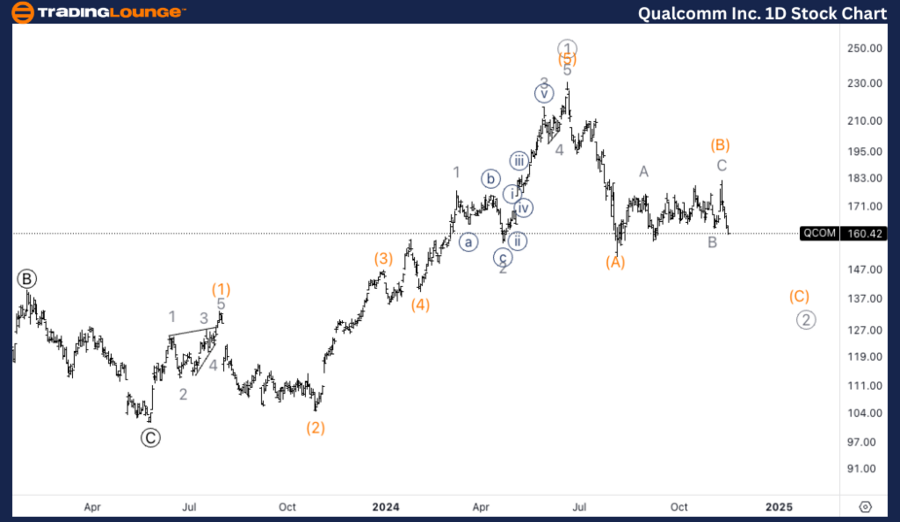
QCOM Elliott Wave technical analysis
Function: Counter Trend.
Mode: Corrective.
Structure: ZigZag.
Position: Wave (C) of 2.
Direction: Downside in wave (C).
Details: Looking for further downside into Primary degree wave 2. There is a possibility we have a much larger top in place at 230$ and we are actually within a larger degree correction.
QCOM Elliott Wave technical analysis – Daily chart
On the daily chart, QCOM appears to be in the final leg of a ZigZag correction, specifically within wave (C) of Primary degree wave 2. The stock has likely completed a larger top around $230 and is now in a corrective phase. The expectation is for further downside as wave (C) unfolds. A deeper correction may occur, especially as the broader corrective structure continues to play out.
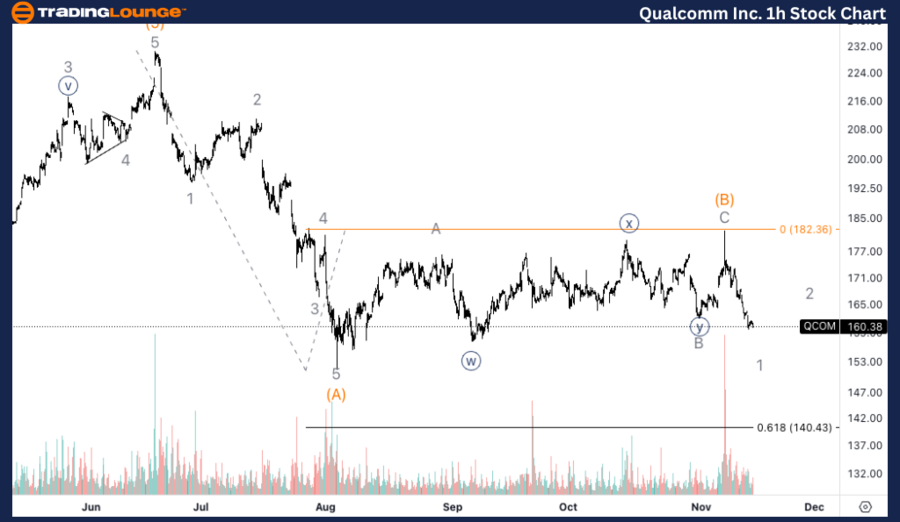
QCOM Elliott Wave technical analysis
Function: Counter Trend.
Mode: Corrective.
Structure: ZigZag.
Position: Wave 1 of (C).
Direction: Bottom in wave 1.
Details: Looking for a bottom in wave 1 to then pullback into wave 2 where you could start to look for shorts. 0.618 (C) vs. (A) stands at 140$.
QCOM Elliott Wave technical analysis – One-hour chart
On the 1-hour chart, QCOM is potentially completing wave 1 of (C). After wave 1 concludes, a pullback in wave 2 is expected, which could provide a shorting opportunity. The Fibonacci 0.618 retracement level of wave (C) vs. wave (A) is estimated around $140, serving as a potential downside target in the larger corrective move.
This Elliott Wave analysis of QUALCOMM Inc., (QCOM) outlines both the daily and 1-hour chart structures, highlighting the current trends and possible future price movements.
Qualcomm Inc. (QCOM) Elliott Wave technical analysis [Video]
Author

Peter Mathers
TradingLounge
Peter Mathers started actively trading in 1982. He began his career at Hoei and Shoin, a Japanese futures trading company.


