Procter and Gamble (PG Stock) should continue rally to complete the cycle from 2020
Since the crash of March 2020, all stocks have tried to recover what they lost and PG was no exception. PG did not only recover from the loss, but it also reached historic highs. We tried to build an impulse from wave II with the first target of $154.00, but market movements of last months have shown the impulse from wave II ended at 147.23 as wave III and PG appear to have entered in an ending diagonal structure from March 2020 low.
PG February daily chart
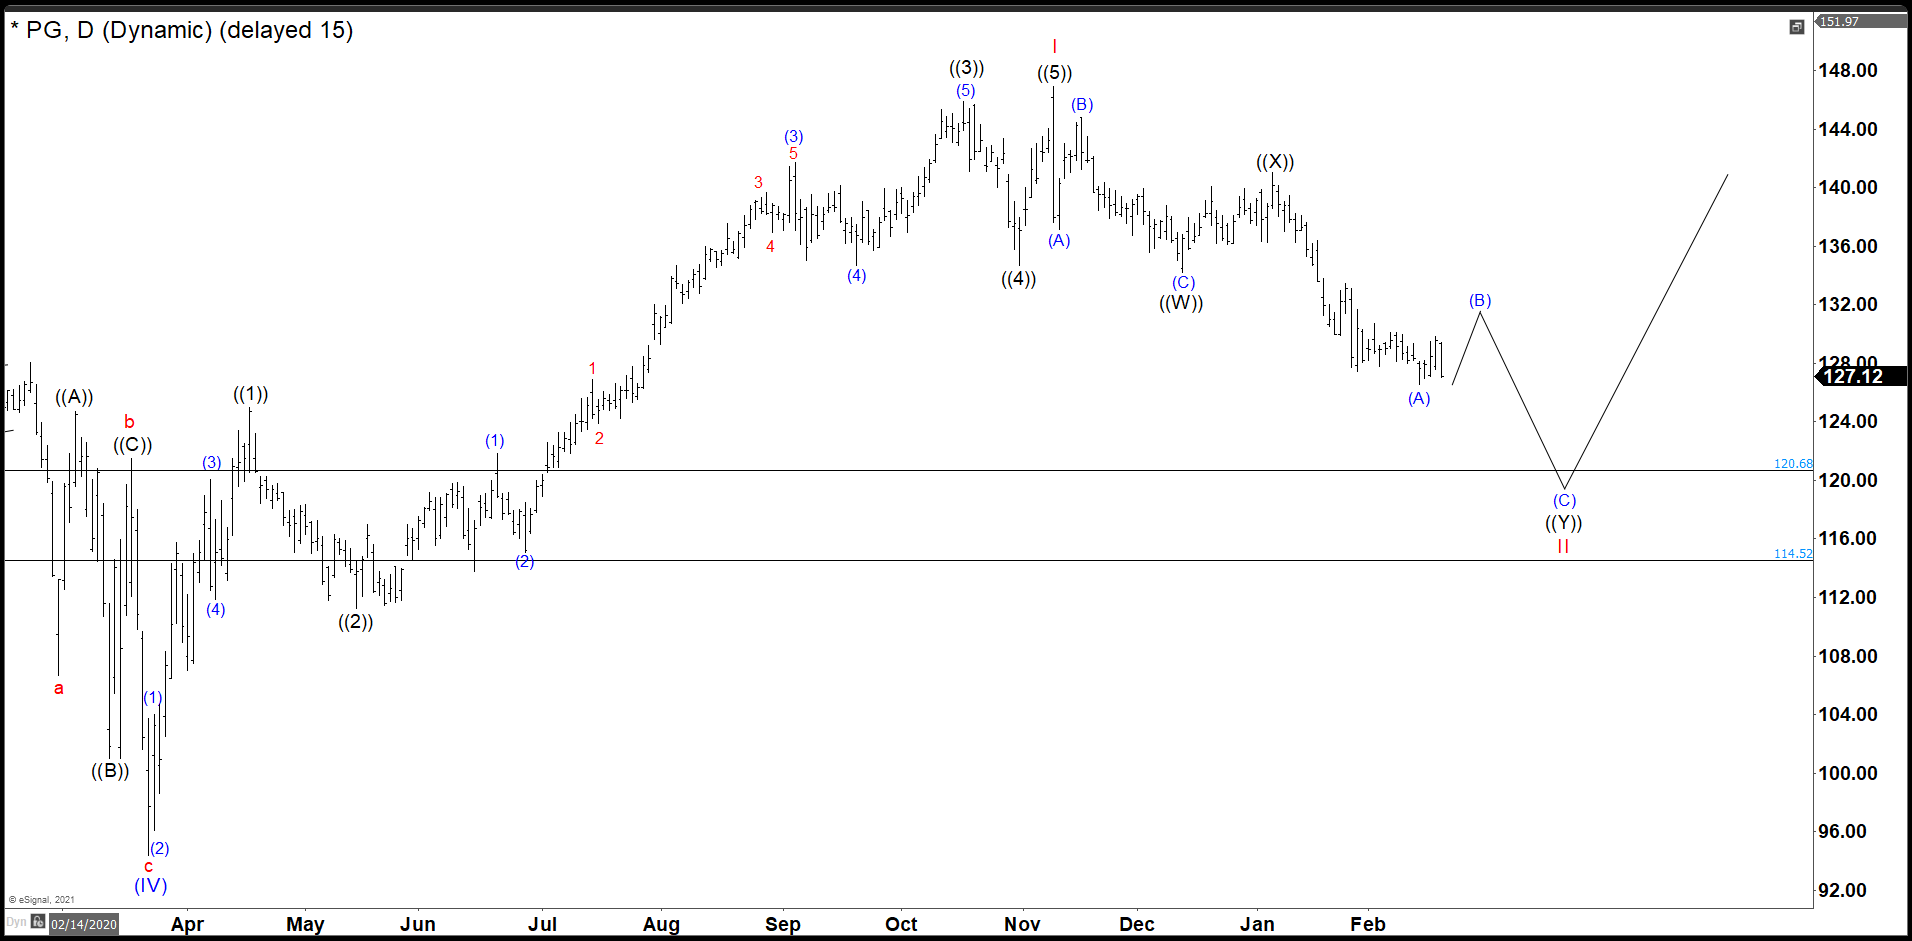
As we see in the daily chart, PG built an impulse ((1)), ((2)), ((3)), ((4)), and ((5)) that we call me in red and it ended at 146.92. Then, we saw the stock with an incomplete bearish sequence and we called 2 swings more down (B) and (C) in blue to finish wave ((Y)) forming a double correction as wave II.
PG July daily chart
The market dropped and wave II bounced from 121.54 dollars missing our ideal level for a few cents at 120.68.
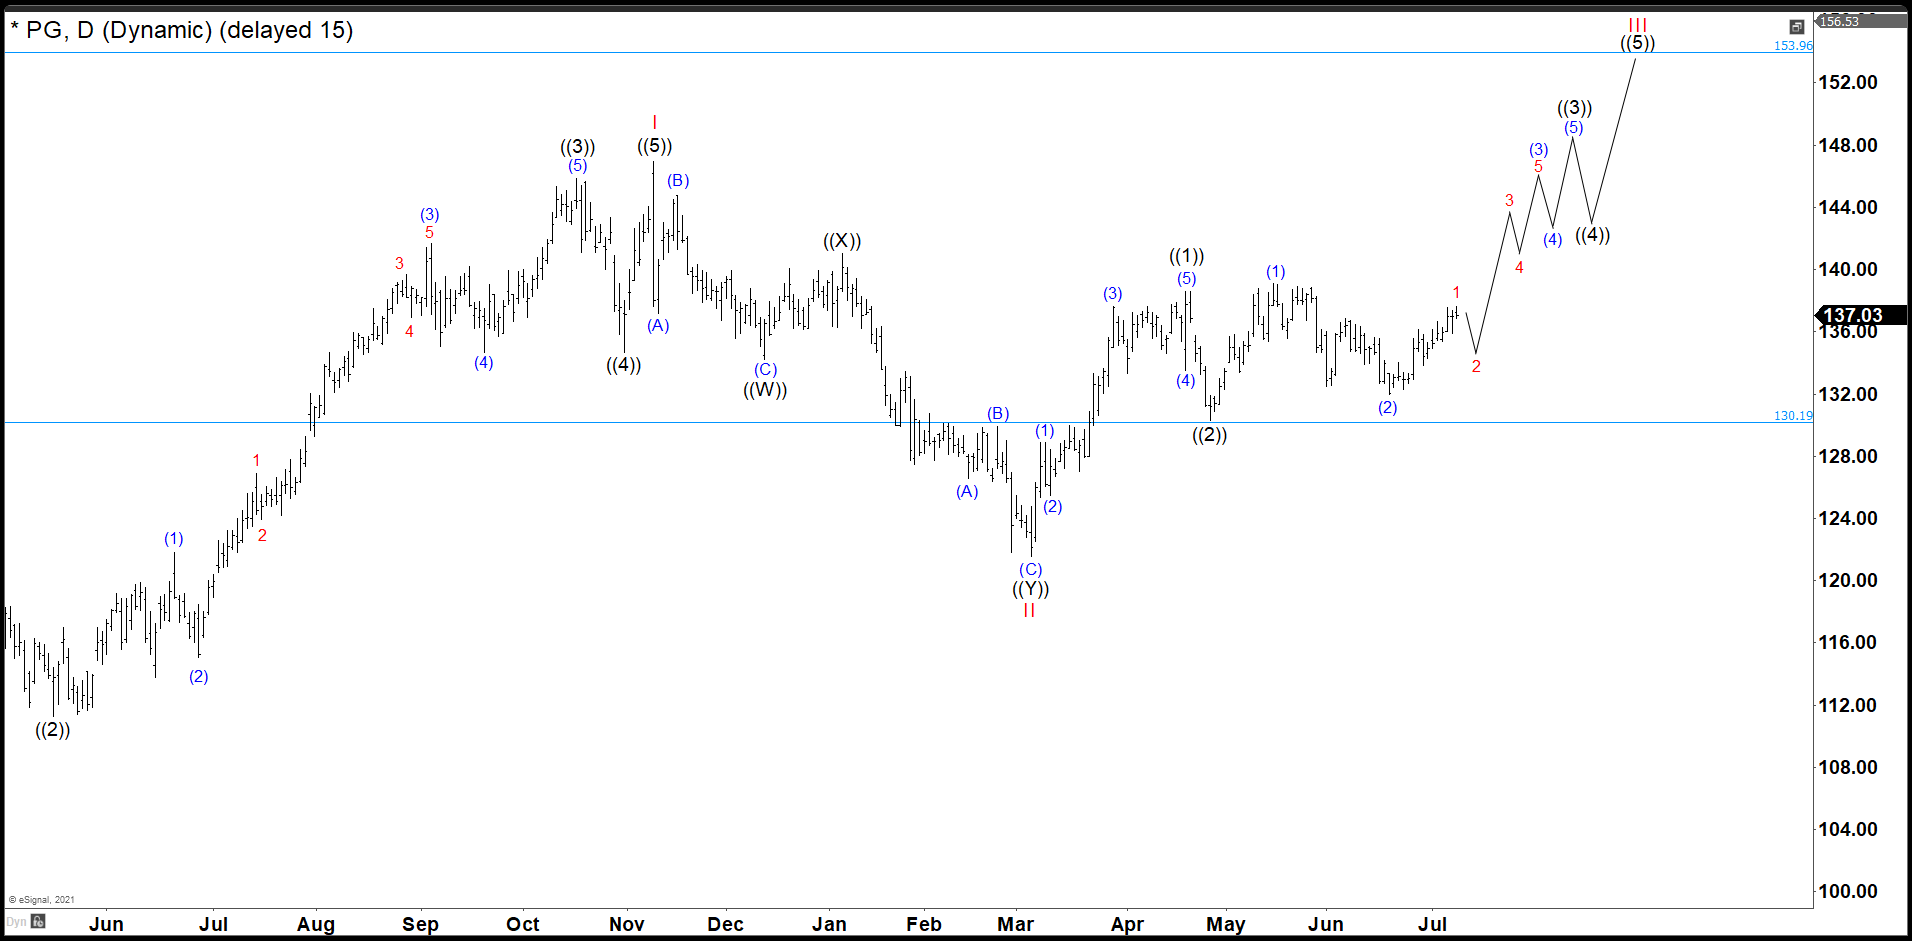
PG September daily chart
P&G rallied, and it completed wave ((1)) at 138.63 dollars. Also, we have seen a pullback that bounced at 130.19 dollars, Fibonacci 50% retracement, ending for us the wave ((2)). Wave (1) of ((3)) ends at 139.18 and wave (2) of ((3)) made a double correction to complete at 131.93. Wave (3) of ((3)) ended at 145.97 and wave (4) of ((3)) pullback completed at 141.47. At this moment, we were calling one more high to 147.19 – 149.97 area to complete wave the whole wave ((3)). The stock hit the area at 147.23, but the pullback as wave ((4)) was to dip to consider a wave ((4)) and we rebuilt the count from wave II ending the impulse at 147.23 as wave III. (If you want to learn more about Elliott Wave Theory, please follow these links: Elliott Wave Education and Elliott Wave Theory).
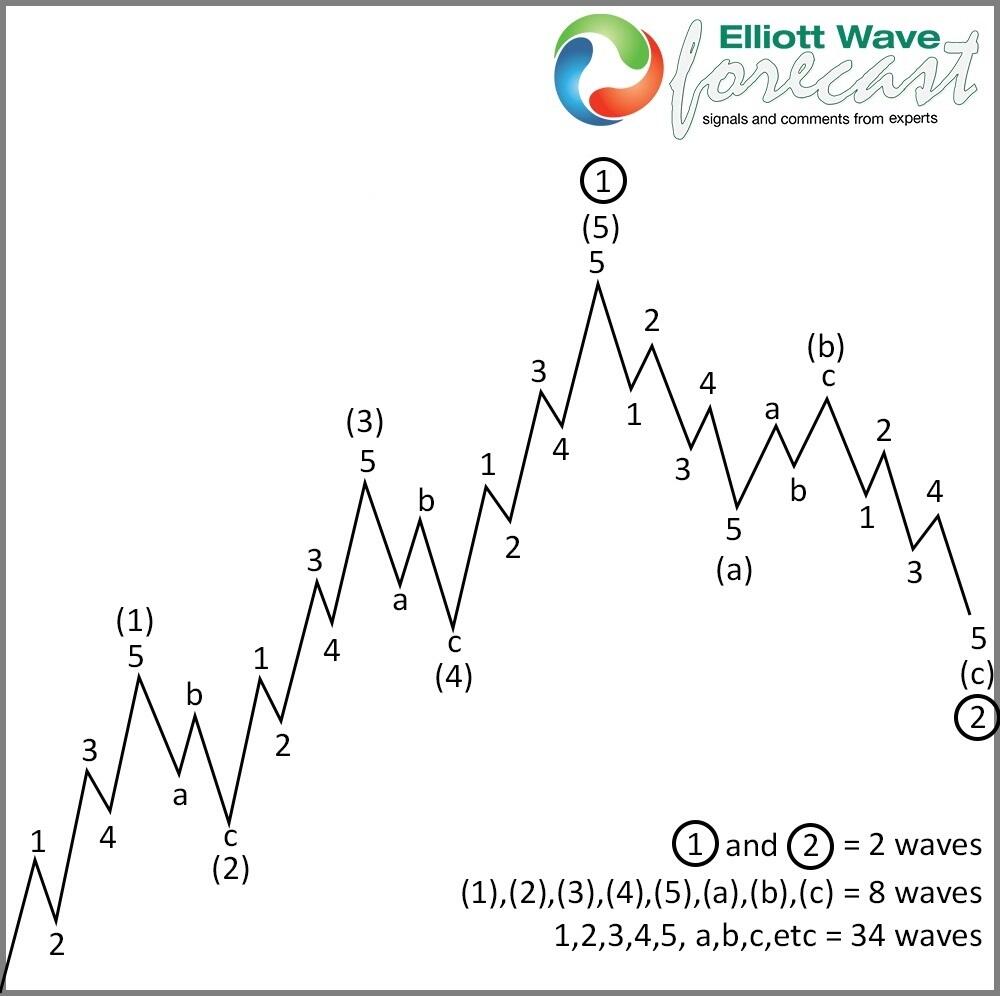
Elliott Wave theory motive wave structure
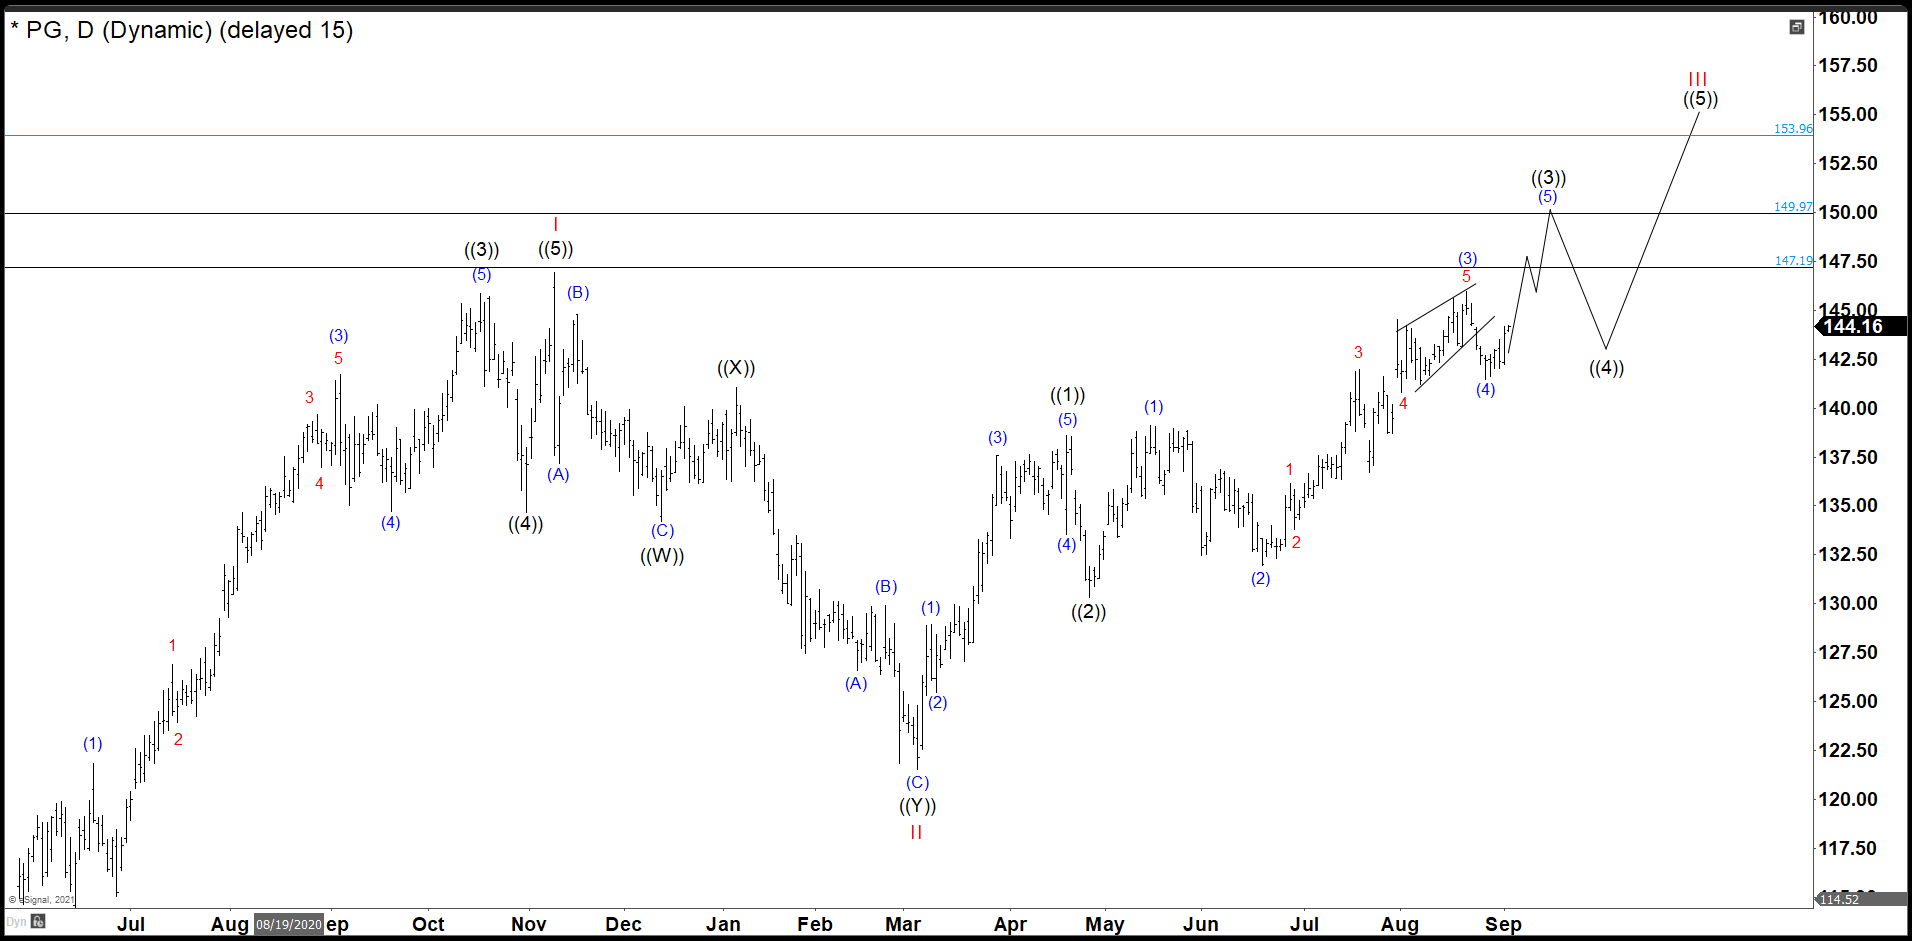
PG daily chart
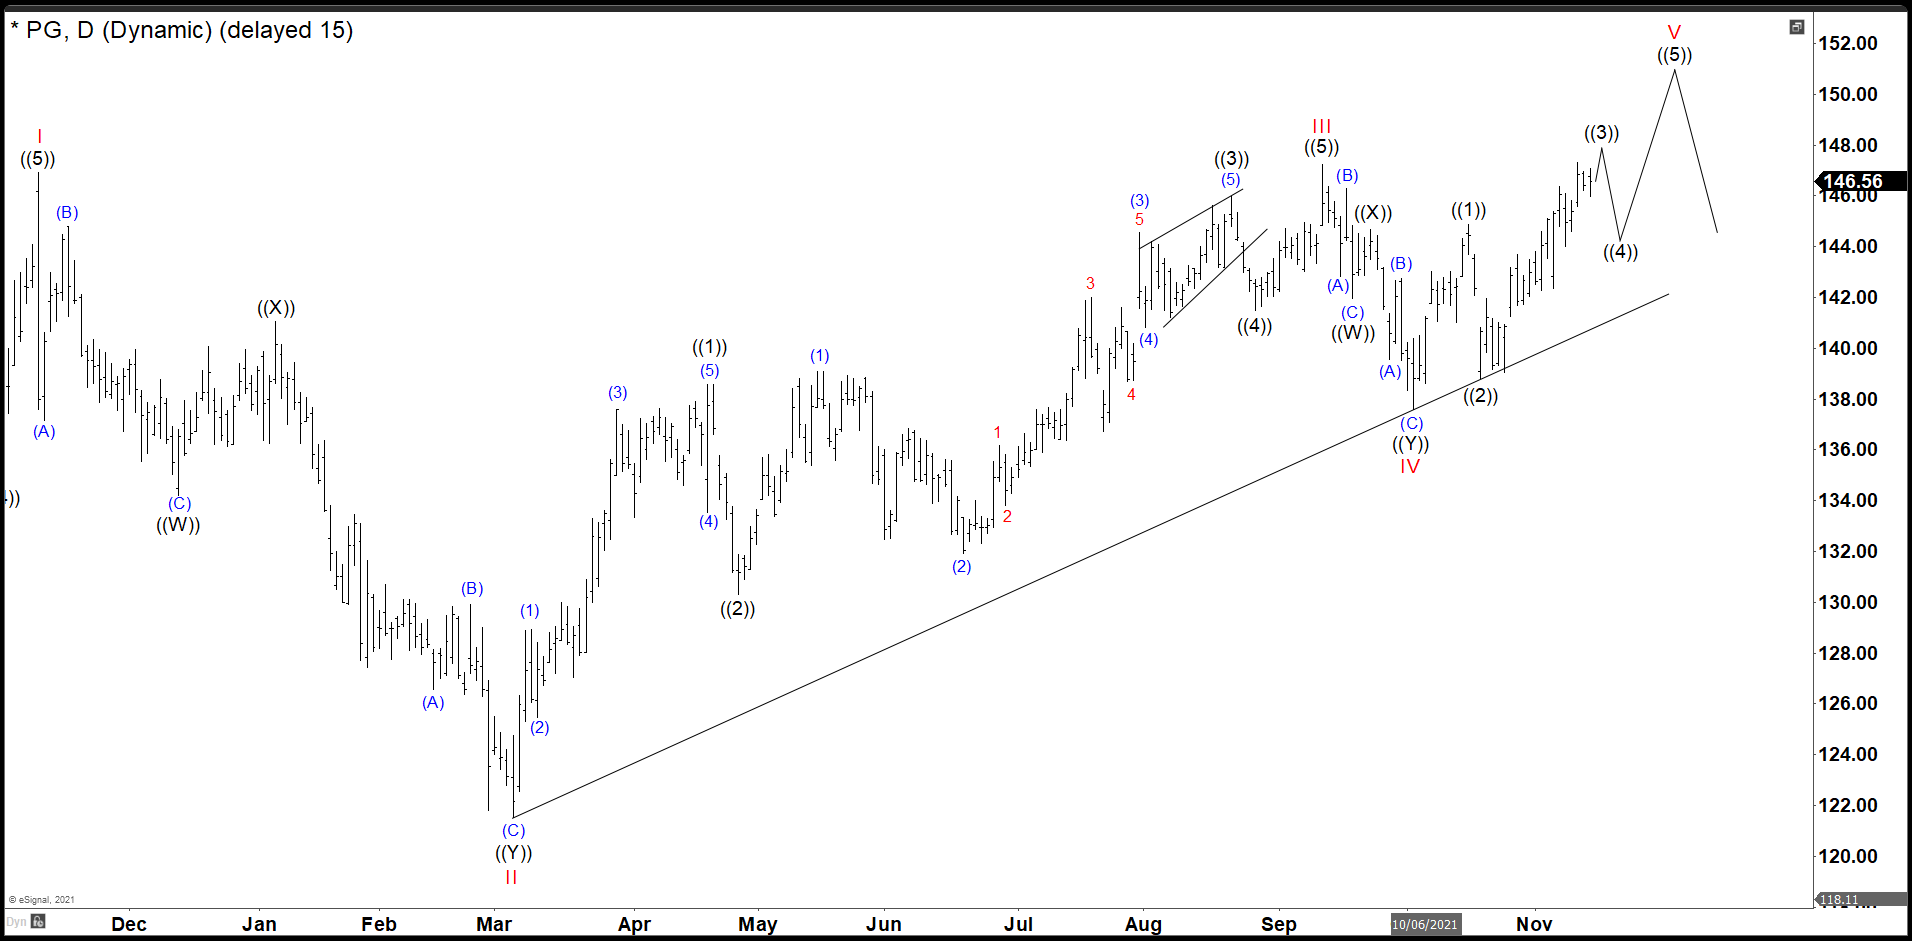
At last, wave III was finished. Wave ((1)) of III ended at 139.18, wave ((2)) ended at 131.93. Wave ((3)) completed at 145.98 with an ending diagonal as wave (5). Wave ((4)) correction finished at 141.47 and the last push to 147.23 as we know. Then we have a deep pullback as a double correction completed wave IV at 137.60 and that is why it is better to consider that the structure from March low is an ending diagonal.
Actually, wave V already ended with 2 swings. Wave ((1)) at 144.87 and wave ((2)) at 138.80. Wave ((3)) almost should be done; therefore, we are near a pullback as wave ((4)) before the rally to complete wave fifth. This rally could end in 149.56 – 153.26 at first view and we could expect a nice correction from those levels.
Premium
You have reached your limit of 3 free articles for this month.
Start your subscription and get access to all our original articles.
Author

Elliott Wave Forecast Team
ElliottWave-Forecast.com


