GBP/USD Price Analysis: Could test the level of 1.2600, next support at March’s low
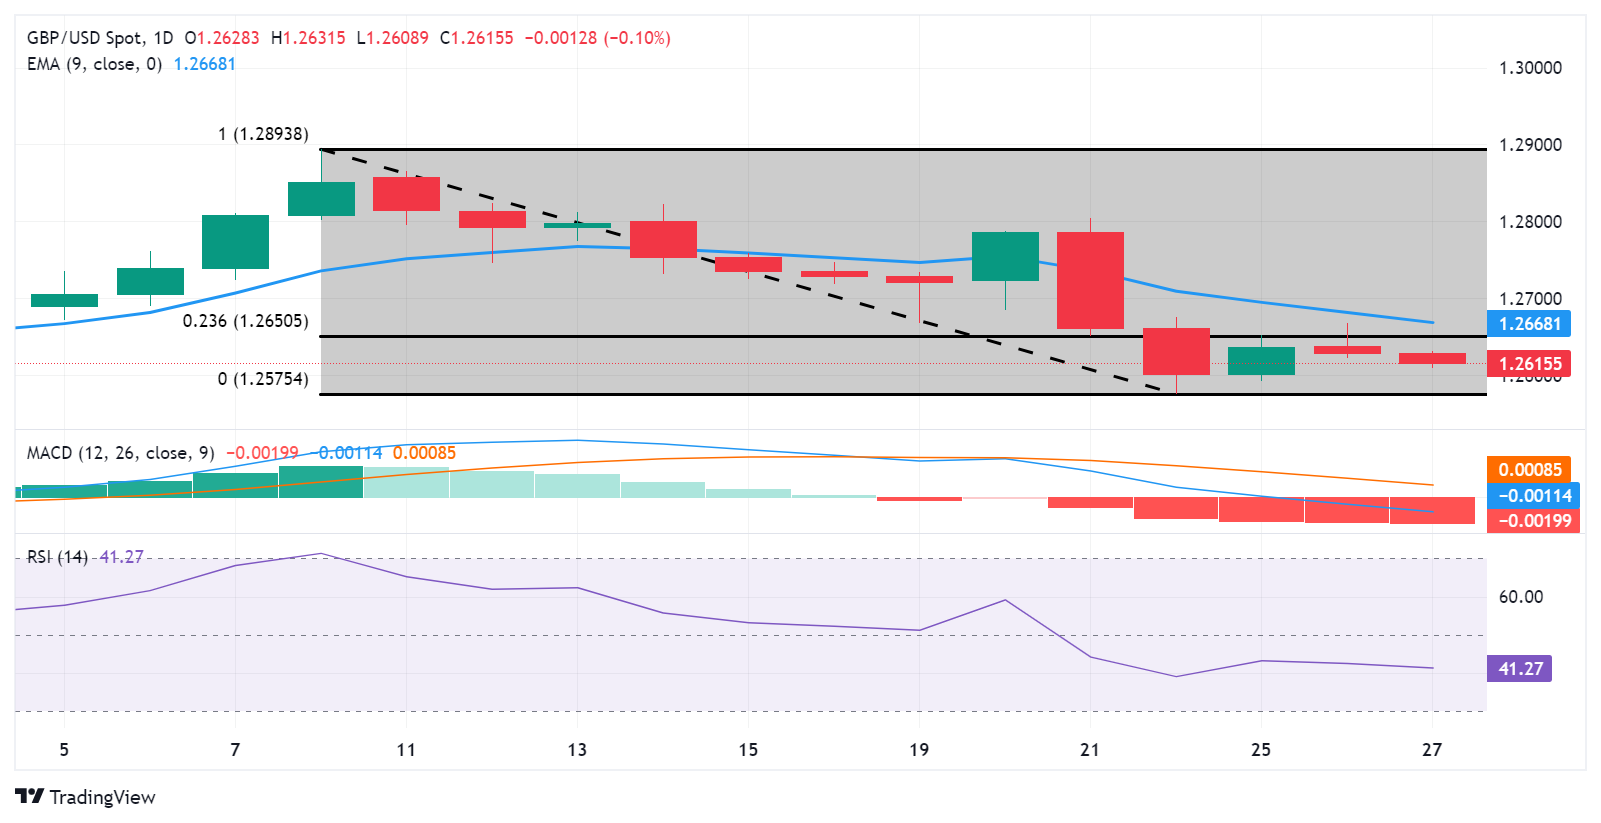
GBP/USD extends its losses for the second consecutive day, depreciating to near 1.2620 during the Asian session on Wednesday. The pair could test the psychological support level of 1.2600. If this level is breached, it could prompt the pair to revisit March’s low at 1.2575.
The technical analysis of the GBP/USD pair suggests a bearish trend. The 14-day Relative Strength Index (RSI) is positioned below 50, indicating a bearish sentiment. Additionally, the Moving Average Convergence Divergence (MACD) confirms the bearish trend, as the MACD line is below the centerline and exhibits divergence below the signal line. Read more...
GBP/USD drifts lower to 1.2620, UK GDP data looms
The GBP/USD pair edges lower to 1.2620 during the early Asian trading hours on Wednesday. The major pair remains capped under the key 100-day Exponential Moving Average (EMA). Many Federal Reserve (Fed) policymakers stick to their path of interest-rate cuts amid the bumpy road to inflation and expect to cut rates three times in 2024, which might weigh on the Greenback. On Thursday, the US and UK Gross Domestic Product (GDP) data will be released.
Despite recent monthly inflation increases, Fed Chair Jerome Powell said last week that pricing pressures would continue to ease and that it may be appropriate to cut interest rates later this year. The majority of US central bank officials expect to cut rates three times in 2024. These remarks push the Fed's stance more dovish and drag the US Dollar (USD) lower in recent sessions. Read more...
Information on these pages contains forward-looking statements that involve risks and uncertainties. Markets and instruments profiled on this page are for informational purposes only and should not in any way come across as a recommendation to buy or sell in these assets. You should do your own thorough research before making any investment decisions. FXStreet does not in any way guarantee that this information is free from mistakes, errors, or material misstatements. It also does not guarantee that this information is of a timely nature. Investing in Open Markets involves a great deal of risk, including the loss of all or a portion of your investment, as well as emotional distress. All risks, losses and costs associated with investing, including total loss of principal, are your responsibility. The views and opinions expressed in this article are those of the authors and do not necessarily reflect the official policy or position of FXStreet nor its advertisers. The author will not be held responsible for information that is found at the end of links posted on this page.
If not otherwise explicitly mentioned in the body of the article, at the time of writing, the author has no position in any stock mentioned in this article and no business relationship with any company mentioned. The author has not received compensation for writing this article, other than from FXStreet.
FXStreet and the author do not provide personalized recommendations. The author makes no representations as to the accuracy, completeness, or suitability of this information. FXStreet and the author will not be liable for any errors, omissions or any losses, injuries or damages arising from this information and its display or use. Errors and omissions excepted.
The author and FXStreet are not registered investment advisors and nothing in this article is intended to be investment advice.


Recommended content
Editors’ Picks

EUR/USD soars past 1.1200 as China's tariffs confirmed at 145%
EUR/USD soared beyond 1.1200 amid headlines confirming the latest round of tariffs, levies on Chinese imports reached 145%. Wall Street collapses amid renewed concerns that Trump's policies will hit the American economy. Soft US inflation data released earlier in the day adds to the broad US Dollar's weakness.

GBP/USD retreats from daily highs, holds above 1.2900
GBP/USD retreats from the daily high it set near 1.2950 but manages to stay in positive territory above 1.2900. The US Dollar stays under strong selling pressure following the weaker-than-expected Consumer Price Index (CPI) data but the risk-averse market atmosphere limits the pair's upside.

Gold climbs to five-day highs around $3,150
Gold now accelerates its upside momentum and advances to multi-day peaks around the $3,150 mark per troy ounce, remaining within a touching distance of the record-high it set last week. The persistent selling pressure surrounding the US Dollar and the negative shift seen in risk mood help XAU/USD push higher.

Cardano stabilizes near $0.62 after Trump’s 90-day tariff pause-led surge
Cardano stabilizes around $0.62 on Thursday after a sharp recovery the previous day, triggered by US Donald Trump’s decision to pause tariffs for 90 days except for China and other countries that had retaliated against the reciprocal tariffs announced on April 2.

Trump’s tariff pause sparks rally – What comes next?
Markets staged a dramatic reversal Wednesday, led by a 12% surge in the Nasdaq and strong gains across major indices, following President Trump’s unexpected decision to pause tariff escalation for non-retaliating trade partners.

The Best brokers to trade EUR/USD
SPONSORED Discover the top brokers for trading EUR/USD in 2025. Our list features brokers with competitive spreads, fast execution, and powerful platforms. Whether you're a beginner or an expert, find the right partner to navigate the dynamic Forex market.