- Plug Power is due to report earnings after the close on Tuesday.
- PLUG is a well-followed retail favourite stock with resulting volatility swings.
- PLUG stock rose over 6% on Monday in advance of the results.
Will the imminent release of earnings from Plug Power (symbol PLUG) be another case of "buy the rumor, sell the fact". PLUG shares have certainly made their move on Monday with a strong 6.7% gain. It is important to see if this can be added to on Tuesday before earnings come out after the close. PLUG is a green energy stock and in the right sector currently, as increased attention on climate change sees inflows to clean energy and green stocks. President Biden's stimulus bill is a benefit and so too is the ongoing climate conference COP26 in Glasgow, Scotland.
Here is a bit of background on PLUG for those not familiar with the name. "With proven hydrogen and fuel cell products, Plug Power replaces lead-acid batteries to power electric industrial vehicles, such as the lift trucks customers use in their distribution centers. Extending its reach into the on-road electric vehicle market, Plug Power’s ProGen platform of modular fuel cell engines empowers OEMs and system integrators to rapidly adopt hydrogen fuel cell technology," according to the company website.
PLUG Power (PLUG) stock news
The US finally got the infrastructure bill across the line on Monday, and this sent many industrial and clean energy stocks higher. The bill is the largest clean energy bill ever in the US with $150 billion for clean energy advancement.
PLUG reports earnings after the close on Tuesday. Earnings per share (EPS) is expected to be -$0.09. Revenue is expected to rise to $143.93 million versus revenue for last year at $125.6 million.
PLUG Power (PLUG) stock forecast
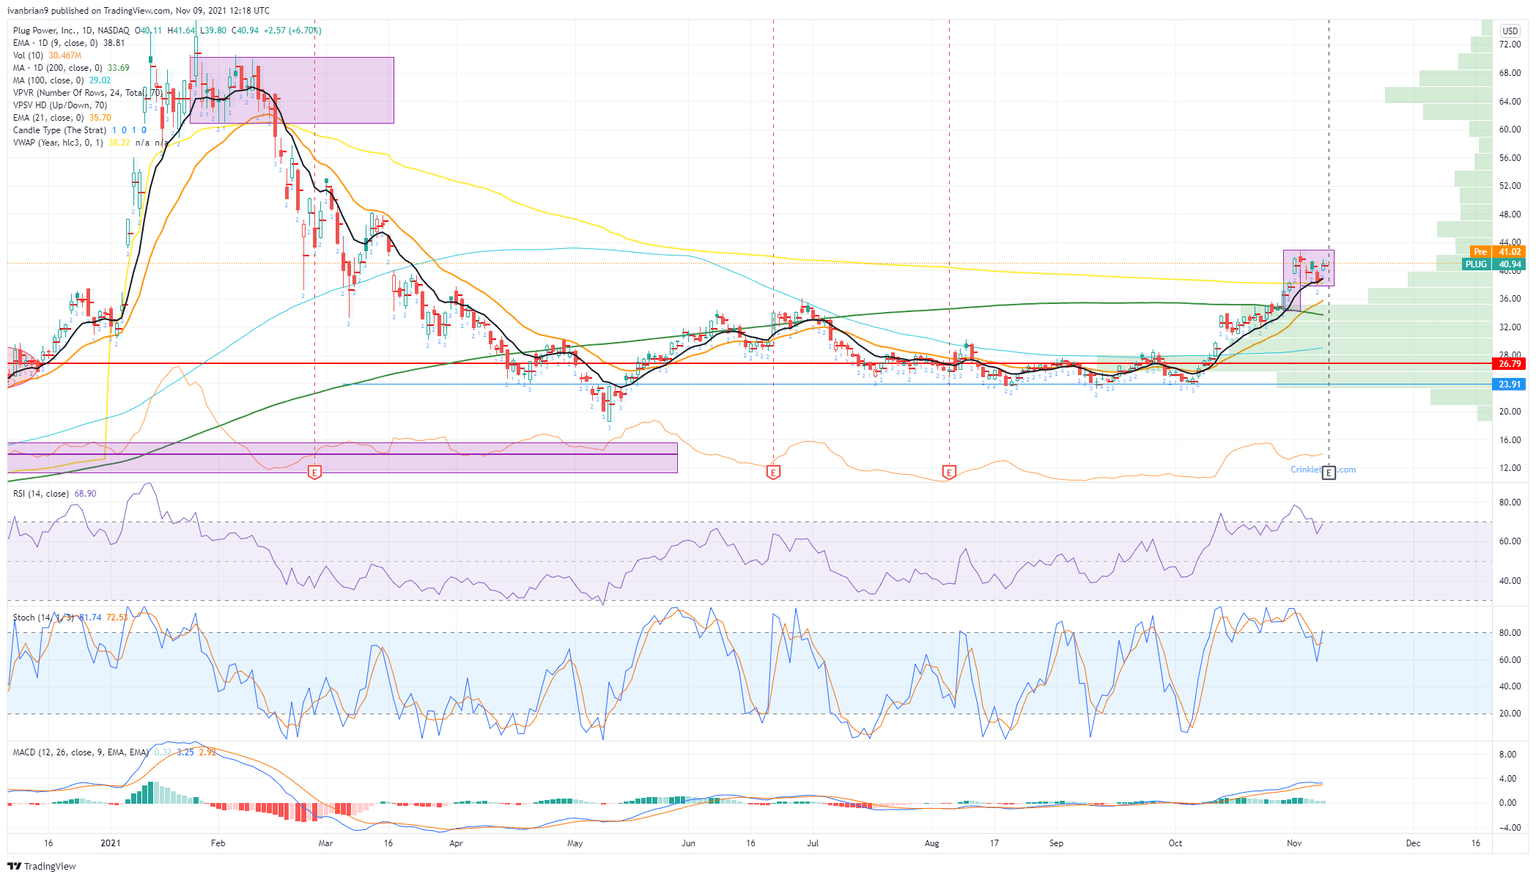
PLUG shares have been trending nicely and have taken out some key levels. The 200-day at $33.69 and the yearly VWAP at $38.22 are now behind us, and PLUG is being guided higher by the 9-day moving average. The extended target is a move back to the consolidation zone from early January and February of this year at $61 to $68, which we have highlighted in the PLUG chart below. Strong support zones are at $33.69 and $28 with some very high volume.
A flag formation is in evidence, and this is a continuation of that pattern. Holding above the lower level of the flag at $38 keeps the bullish possibility intact. This $38 level also neatly aligns with the 9-day moving average. Above we look for gains, below look at the strong suppport zones mentioned, but always use a stop.
PLUG daily chart
Information on these pages contains forward-looking statements that involve risks and uncertainties. Markets and instruments profiled on this page are for informational purposes only and should not in any way come across as a recommendation to buy or sell in these assets. You should do your own thorough research before making any investment decisions. FXStreet does not in any way guarantee that this information is free from mistakes, errors, or material misstatements. It also does not guarantee that this information is of a timely nature. Investing in Open Markets involves a great deal of risk, including the loss of all or a portion of your investment, as well as emotional distress. All risks, losses and costs associated with investing, including total loss of principal, are your responsibility. The views and opinions expressed in this article are those of the authors and do not necessarily reflect the official policy or position of FXStreet nor its advertisers. The author will not be held responsible for information that is found at the end of links posted on this page.
If not otherwise explicitly mentioned in the body of the article, at the time of writing, the author has no position in any stock mentioned in this article and no business relationship with any company mentioned. The author has not received compensation for writing this article, other than from FXStreet.
FXStreet and the author do not provide personalized recommendations. The author makes no representations as to the accuracy, completeness, or suitability of this information. FXStreet and the author will not be liable for any errors, omissions or any losses, injuries or damages arising from this information and its display or use. Errors and omissions excepted.
The author and FXStreet are not registered investment advisors and nothing in this article is intended to be investment advice.
Recommended content
Editors’ Picks
AUD/USD turns south toward 0.6500 as US Dollar finds fresh demand
AUD/USD hs turned south toward 0.6500 in Asian trading on Wednesday. The pair lacks bullish conviction after the PBOC left the Lona Prime Rates unchanged. Escalating Russia-Ukraine geopolitical tensions and renewed US Dollar demand keep the Aussie on the edge ahead of Fedspeak.
USD/JPY jumps back above 155.00 as risk sentiment improves
USD/JPY has regained traction, rising back above 155.00 in Wednesday's Asian session. A renewed US Dollar uptick alongside the US Treasury bond yields and an improving risk tone counter Japanese intervention threats and Russia-Ukraine tensions, allowing the pair to rebound.
Gold advances to over one-week high on rising geopolitical risks
Gold price (XAU/USD) attracts some follow-through buying for the third consecutive day on Wednesday and climbs to a one-and-half-week high, around the $2,641-2,642 region during the Asian session.
UK CPI set to rise above BoE target in October, core inflation to remain high
The United Kingdom’s (UK) Consumer Price Index (CPI) data for October will be published by the Office for National Statistics (ONS) on Wednesday at 07:00 GMT.
How could Trump’s Treasury Secretary selection influence Bitcoin?
Bitcoin remained upbeat above $91,000 on Tuesday, with Trump’s cabinet appointments in focus and after MicroStrategy purchases being more tokens.
Best Forex Brokers with Low Spreads
VERIFIED Low spreads are crucial for reducing trading costs. Explore top Forex brokers offering competitive spreads and high leverage. Compare options for EUR/USD, GBP/USD, USD/JPY, and Gold.