PLTR [Palantir] Elliott Wave structure calls for new all time highs
![PLTR [Palantir] Elliott Wave structure calls for new all time highs](https://editorial.fxstreet.com/images/Markets/Equities/Industries/Hardware/pic-hardware-close-up_XtraLarge.jpg)
Palantir Technologies (PLTR), Inc. is a holding company, which engages in the development of data integration and software solutions. It operates through the Commercial and Government segments. The firm offers automotive, financial compliance, legal intelligence, mergers, and acquisitions solutions. PLTR has been rallying strongly since forming a low in December 2022. The rally has gained momentum recently and keeps extending. Today, we take a closer look at the big picture view of Palantir and also look at the internal structure of the rally from the December 2022 low.
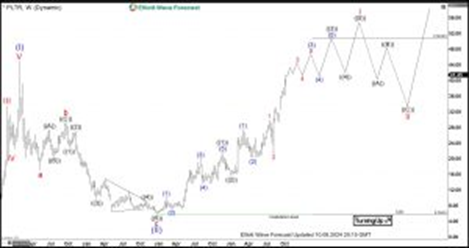
PLTR [Palantir] weekly Elliott Wave analysis [10.8.2024]
Palantir ended a cycle at $45.00 in January 2021. Then it did a deep pullback as a Zig Zag Elliott Wave correction ending wave (II) at 5.91 low. The market started an impulse structure in wave ((1)) which completed at $21.87. This was followed by a pullback in wave ((2)) which completed at $15.61 in January 2024. Stock then resumed the rally in wave ((3)) which is still in progress. Price has already exceeded 161.8% Fibonacci extension of wave (1)-(2) at $36.35 and 261.8 Fibonacci extension of wave (1)-(2) comes at $46.15 which could be the next ideal target area to complete wave (3). 100% Fibonacci extension of wave (I) related to wave (II) is at $50.90 and this is the first major target for the rally which started in December 2022. This is above the previous all-time peak of $45 seen back in January 2021.
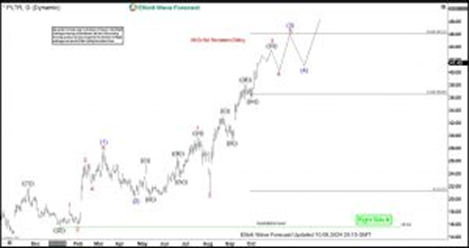
PLTR [Palantir] daily Elliott Wave analysis [10.8.2024]
The daily chart below shows wave ((2)) pullback completed at $15.61. Up from there wave (1) completed at $27.53, wave (2) pullback completed at $20.39 and it’s currently trading higher in wave (3). Currently, we see 11 swings higher from the wave (2) low. 11 swings is a corrective sequence which means we need more upside within the current cycle to complete the impulsive advance before wave (3) concludes. After that we should see a pullback in wave (4) and an extension higher in wave (5) to complete wave ((3)).
Author

Elliott Wave Forecast Team
ElliottWave-Forecast.com


