PepsiCo finds support in the blue box – Extended rally ahead?

PepsiCo is a global food and beverage company with the headquarters in New York. It was founded in 1965 through the merger of Pepsi-Cola and Frito-Lay. The company operates in over 200 countries and has a diverse portfolio of brands, including Pepsi, Mountain Dew, Lay’s, Doritos, Gatorade, Tropicana, and Quaker.
Despite the sell-off from May 2023, the PepsiCo stock remains within the all-time bullish cycle. Many times, within the bullish sequence, the price pulls back to give buyers the opportunity to buy lower and sell higher for profit. That appears to be the case for $PEP. The decline from May 2025 marked the wave (IV) of the supercycle degree within the bullish cycle from the all-time low. On 16th February 2025, we shared an article titled ”PepsiCo May End The Bearish Cycle From 2023 Soon”. In the article, we used the chart below to identify the extreme area for wave (IV). The blue box on our charts show members where to buy within a bullish sequence and where to sell within a bearish sequence.
PepsiCo weekly chart 16th February, 2025
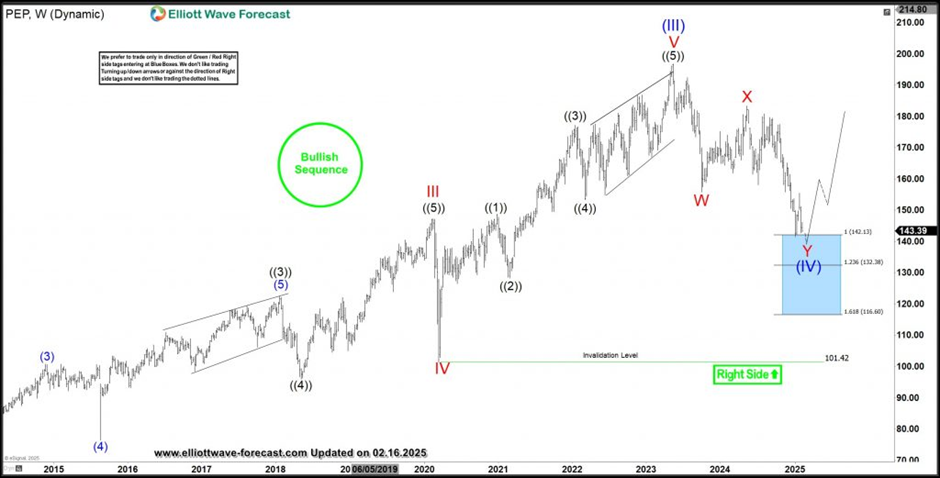
We identified 142.13-116.60 as the blue box where we expected wave (IV) to finish after a 7-swing structure. Afterwards, wave (V) should begin. If not a bullish impulse wave reaction, at least a 3-swing bounce should ensue from this extreme area. The chart below shows the price’s response after about a week.
PepsiCo weekly chart 22th February, 2025
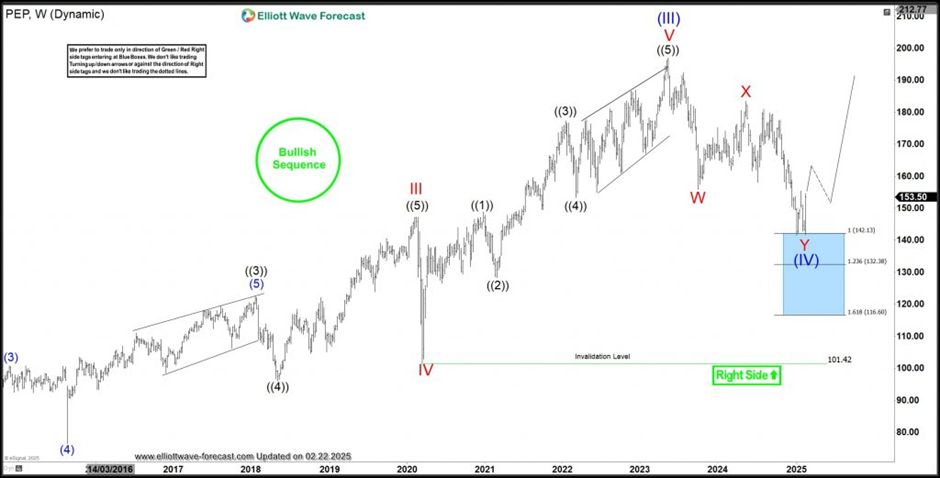
The stock found support at the blue box just as expected. Thus, price bounced off the entrance of the blue box – barely at the 142.13 proposed entry level. While price holds above 116.60, it should separate further from the blue box. When the rally reaches 162.53, traders should consider closing half of the trade in profit and adjust the rest of the position to breakeven. Until 162.5, buyers from the blue box should continue to hold the long, while keeping the stop at 116. Therefore, the upside appears to be favored in the short and long terms.
Author

Elliott Wave Forecast Team
ElliottWave-Forecast.com


