|

Pan American Silver (PAAS) bottom can be in place

Silver (XAGUSD) has ended correction to the cycle from 2020 low and turning higher. This would suggest that silver miners most likely have formed the bottom as well. Below is the chart of Pan American Silver (ticker: PAAS), one of the leading precious metal miners. The company is engaged in the production and sale of silver, gold, zinc, lead and copper.

PAAS monthly Elliott Wave chart

Chart

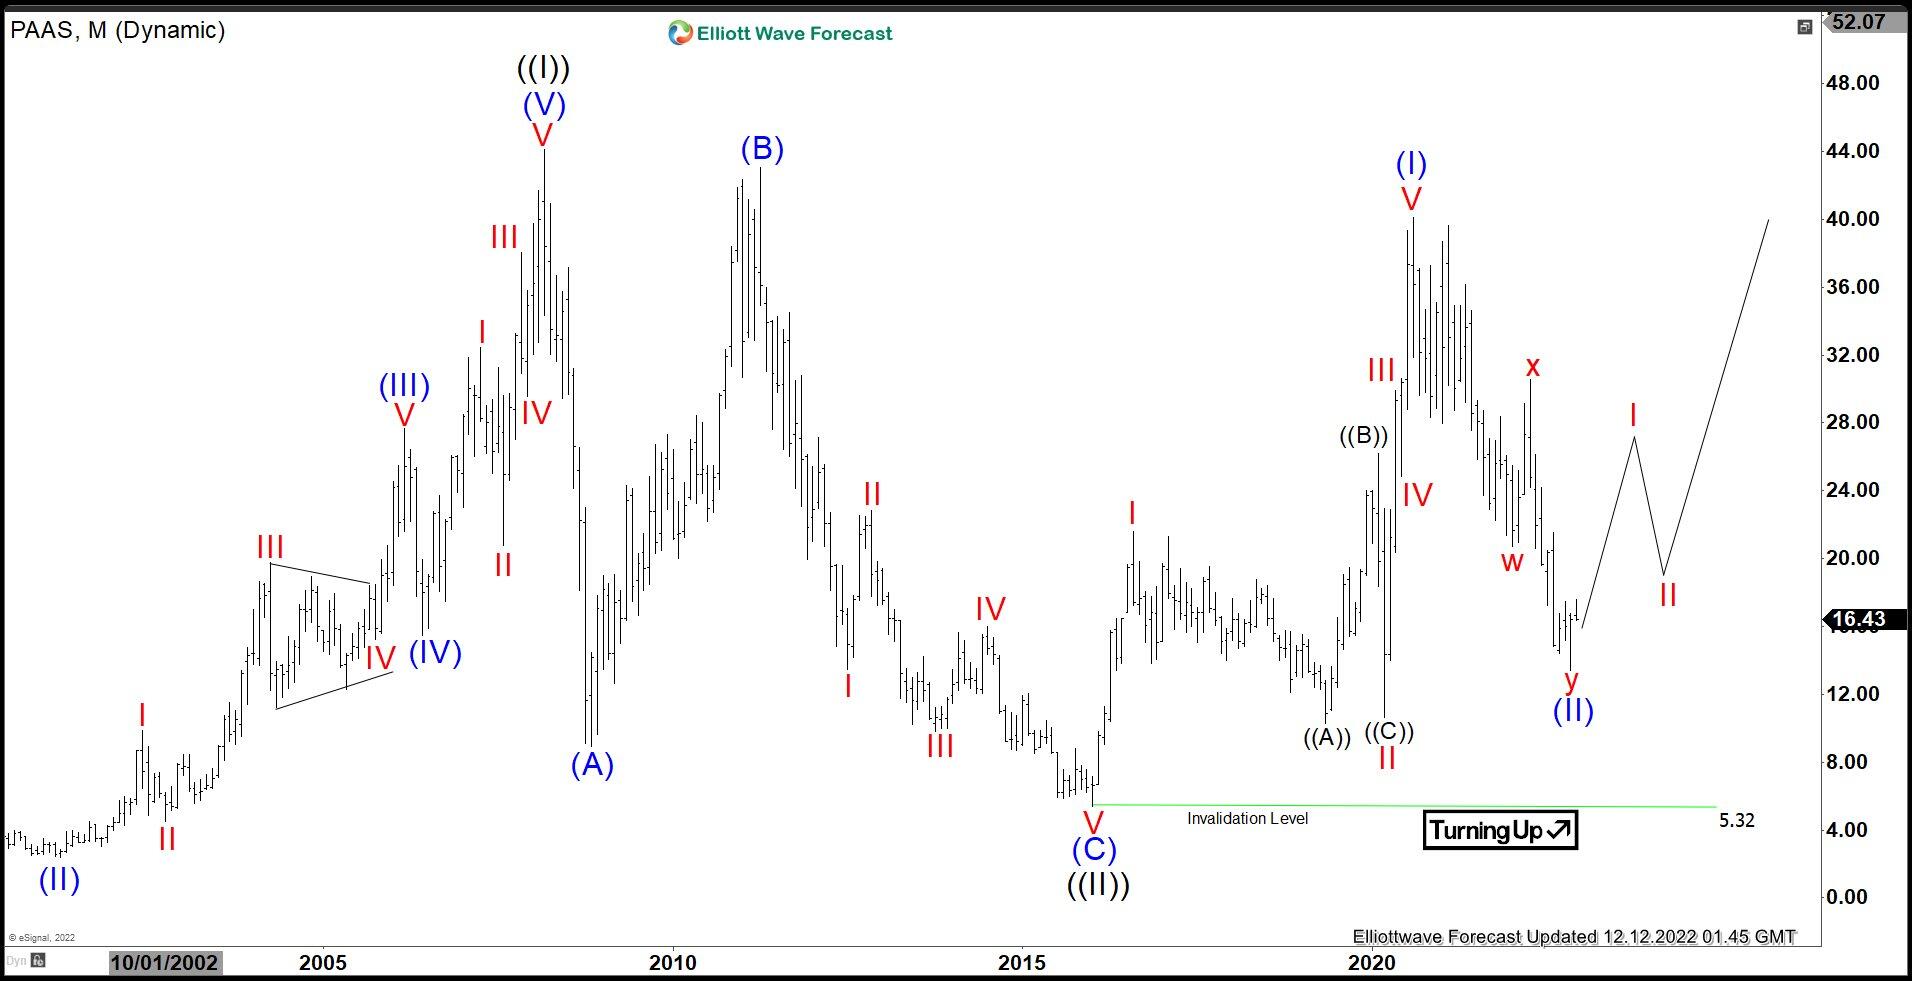
PAAS rally to 44.1 on March 2008 ended wave ((I)). Wave ((II)) pullback ended at 5.32 with internal subdivision as a zigzag Elliott Wave structure. Down from wave ((I)), wave (A) ended at 8.93, rally in wave (B) ended at 43.06, and wave (C) lower ended at 5.32. This completed wave ((II) in higher degree. Up from there, wave (I) ended at 40.11 and wave (II)) is proposed complete at 13.40. As far as pivot at 5.32 low stays intact, expect the stock to continue higher.

PAAS daily Elliott Wave chart

Chart

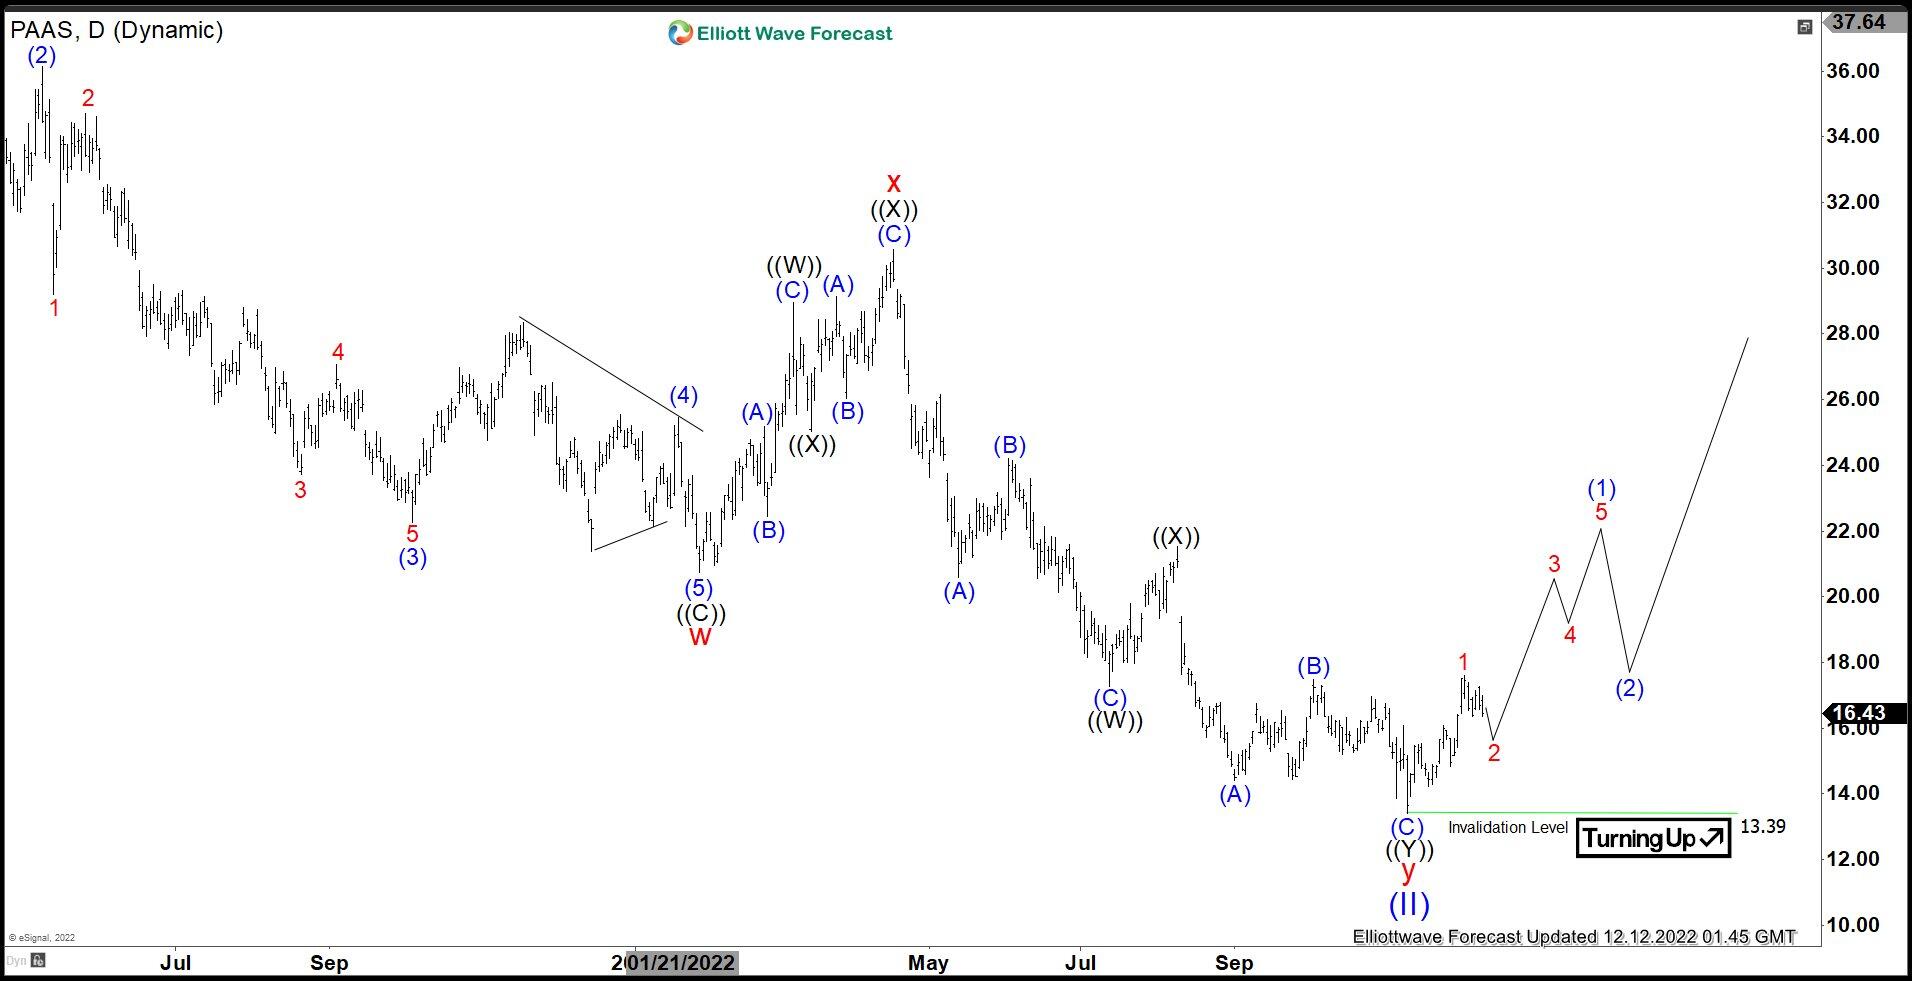
Daily Elliott Wave chart above shows wave (II) ended at 13.39 with internal subdivision as a double three. Down from wave (I) at 40.11, wave w ended at 20.73, and rally in wave x ended at 30.56. Final leg lower wave y ended at 13.39. This completed wave (II) in higher degree. Wave (III) higher is now in progress but it still needs to break above wave (I) at 40.11 to rule out a double correction. Near term, as far as pivot at 13.39 low stays intact, expect dips to find support in 3, 7, 11 swing for further upside.

Author

Elliott Wave Forecast Team

Elliott Wave Forecast Team

ElliottWave-Forecast.com

More from Elliott Wave Forecast Team
Share:

Editor's Picks

EUR/USD accelerates losses, focus is on 1.1800

EUR/USD’s selling pressure is gathering pace now, opening the door to a potential test of the key 1.1800 region sooner rather than later. The pair’s pullback comes on the back of marked gains in the US Dollar following US data releases and the publication of the FOMC Minutes later in the day.

GBP/USD turns negative near 1.3540

GBP/USD reverses its initial upside momentum and is now adding to previous declines, revisiting at the same time the 1.3540 region on Wednesday. Cable’s downtick comes on the back of decent gains in the Greenback and easing UK inflation figures, which seem to have reinforced the case for a BoE rate cut in March.

Gold picks pace, flirts with $5,000

Gold is back on the front foot on Wednesday, shaking off part of the early week softness and pushing higher towards the key $5,000 mark per troy ounce. The move comes ahead of the FOMC Minutes and is unfolding despite an intense rebound in the US Dollar.

Fed Minutes to shed light on January hold decision amid hawkish rate outlook

The Minutes of the Fed’s January 27-28 monetary policy meeting will be published today. Details of discussions on the decision to leave the policy rate unchanged will be scrutinized by investors.

Mixed UK inflation data no gamechanger for the Bank of England

Food inflation plunged in January, but service sector price pressure is proving stickier. We continue to expect Bank of England rate cuts in March and June. The latest UK inflation read is a mixed bag for the Bank of England, but we doubt it drastically changes the odds of a March rate cut.

Sui extends sideways action ahead of Grayscale’s GSUI ETF launch

Sui is extending its downtrend for the second consecutive day, trading at 0.95 at the time of writing on Wednesday. The Layer-1 token is down over 16% in February and approximately 34% from the start of the year, aligning with the overall bearish sentiment across the crypto market.