PANW Elliott Wave technical analysis
Function: Trend.
Mode: Impulsive.
Structure: Motive.
Position: Minor 1 of (5).
Direction: Upside into wave 1.
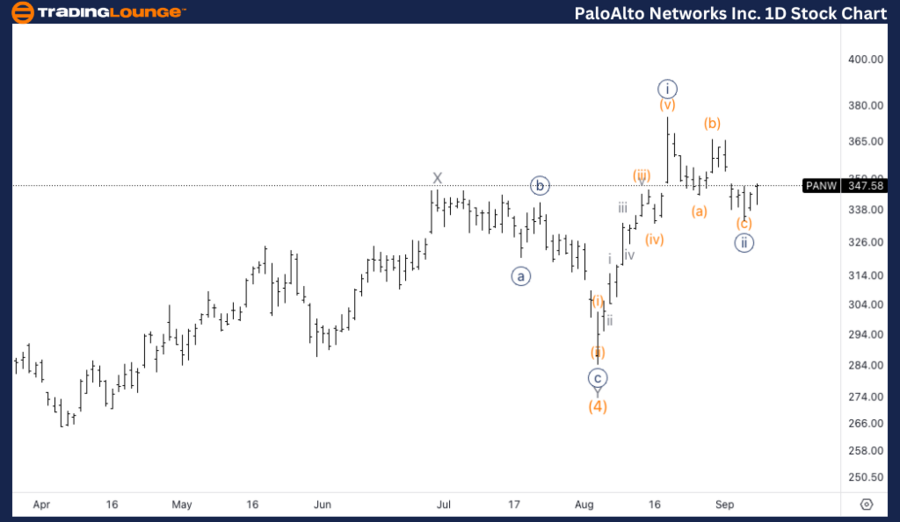
Details: Looking for a resumption of the uptrend after what appears to be a three wave move into wave (4), as we currently stand between TL3 and 400$.
PANW Elliott Wave technical analysis – Daily chart
The daily chart shows that Palo Alto Networks (PANW) is in an impulsive trend. The price is currently progressing within Minor wave 1 of Intermediate wave (5). After completing a corrective three-wave move in wave (4), PANW appears to be resuming its uptrend.
PANW Elliott Wave technical analysis
Function: Trend
Mode: Impulsive
Structure: Motive
Position: Wave {iii} of 1.
Direction: Bottom in wave {ii}.
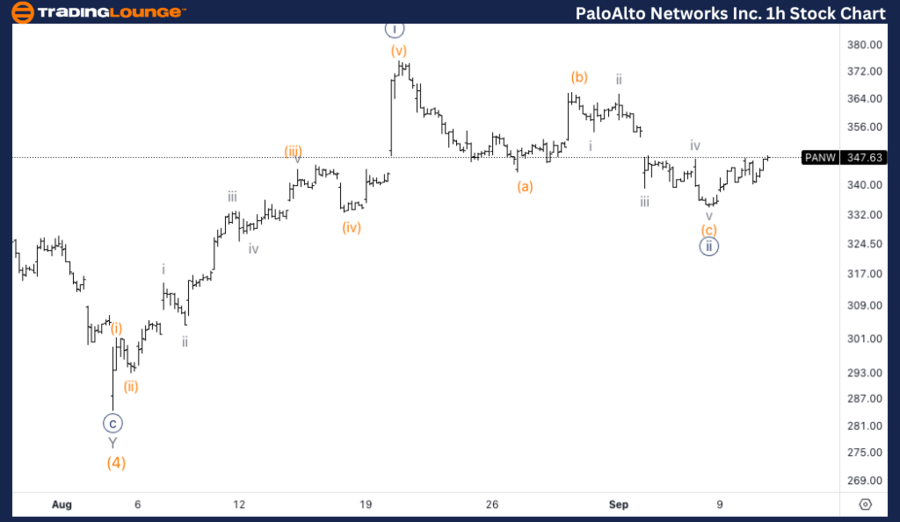
Details: We could also have bottomed in wave 2 already, instead of {ii}. Looking for upside into wave {iii} as we seem to have a clear three wave move into wave {ii}.
PANW Elliott Wave technical analysis – One-hour chart
The 1-hour chart indicates that PANW is progressing within wave {iii} of 1, a highly impulsive and dynamic phase. The analysis suggests that the stock has likely bottomed in wave {ii}, marking the end of a corrective phase. The structure shows a clear three-wave move into wave {ii}, adding confidence to the scenario that wave {iii} is now in play.
In this latest Elliott Wave analysis for Palo Alto Networks Inc. (PANW), we utilize the Elliott Wave Theory to break down PANW's price movements. This analysis will provide traders with insights into potential market opportunities based on the current structure and trends. We'll examine both the daily and 1-hour charts for a clearer understanding of PANW's price trajectory.
PaloAlto Networks Inc. (PANW) Elliott Wave technical analysis [Video]
As with any investment opportunity there is a risk of making losses on investments that Trading Lounge expresses opinions on.
Historical results are no guarantee of future returns. Some investments are inherently riskier than others. At worst, you could lose your entire investment. TradingLounge™ uses a range of technical analysis tools, software and basic fundamental analysis as well as economic forecasts aimed at minimizing the potential for loss.
The advice we provide through our TradingLounge™ websites and our TradingLounge™ Membership has been prepared without considering your objectives, financial situation or needs. Reliance on such advice, information or data is at your own risk. The decision to trade and the method of trading is for you alone to decide. This information is of a general nature only, so you should, before acting upon any of the information or advice provided by us, consider the appropriateness of the advice considering your own objectives, financial situation or needs. Therefore, you should consult your financial advisor or accountant to determine whether trading in securities and derivatives products is appropriate for you considering your financial circumstances.
Recommended content
Editors’ Picks

AUD/USD: Next on the downside comes 0.6500
Further gains in the US Dollar kept the price action in commodities and the risk complex depressed on Tuesday, motivating AUD/USD to come close to the rea of the November low near 0.6500.

EUR/USD: No respite to the sell-off ahead of US CPI
The rally in the Greenback remained well and sound for yet another session, weighing on the risk-linked assets and sending EUR/USD to new 2024 lows in the vicinity of 1.0590 prior to key US data releases.

Gold struggles to retain the $2,600 mark
Following the early breakdown of the key $2,600 mark, prices of Gold now manages to regain some composure and reclaim the $2,600 level and beyond amidst the persistent move higher in the US Dollar and the rebound in US yields.

SOL Price Forecast: Solana bulls maintain $250 target as Binance lists ACT and PNUT
Solana price retraced 7% from $225 to $205 on Tuesday, halting a seven-day winning streak that saw SOL become the third-largest cryptocurrency by market capitalization.
Five fundamentals: Fallout from the US election, inflation, and a timely speech from Powell stand out Premium
What a week – the US election lived up to their hype, at least when it comes to market volatility. There is no time to rest, with politics, geopolitics, and economic data promising more volatility ahead.

Best Forex Brokers with Low Spreads
VERIFIED Low spreads are crucial for reducing trading costs. Explore top Forex brokers offering competitive spreads and high leverage. Compare options for EUR/USD, GBP/USD, USD/JPY, and Gold.