PaloAlto Networks Inc.(PANW) Elliott Wave technical analysis [Video]
![PaloAlto Networks Inc.(PANW) Elliott Wave technical analysis [Video]](https://editorial.fxstreet.com/images/TechnicalAnalysis/ChartPatterns/Candlesticks/close-up-of-candlestick-stock-chart-with-pen-40815814_XtraLarge.jpg)
PANW Elliott Wave technical analysis
Function: Trend.
Mode: Impulsive.
Structure: Motive.
Position: Minor 1 of (5).
Direction: Upside into wave 1.
Details: Looking for a resumption of the uptrend after what appears to be a three wave move into wave (4), as we currently stand between TL3 and 400$.
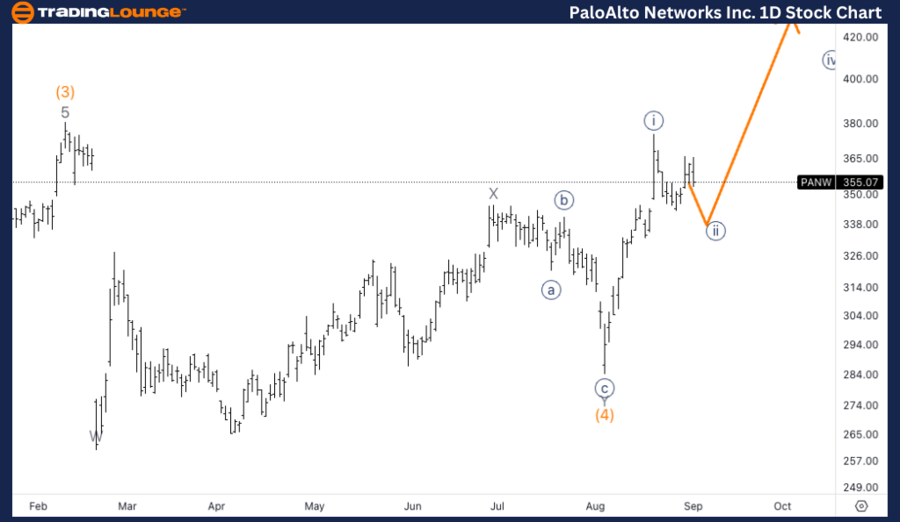
PANW Elliott Wave technical analysis – Daily chart
PANW appears to have completed a three-wave corrective pattern into wave (4), positioning the stock for a resumption of the uptrend. Currently, the stock is trading between TradingLevel3 (TL3) and the 400$ level. This suggests that the stock may be gearing up for a new impulsive move higher in Minor wave 1 of Intermediate wave (5). Traders should monitor for a break above 400$ to confirm the continuation of the uptrend.
PANW Elliott Wave technical analysis
Function: Trend.
Mode: Impulsive.
Structure: Motive.
Position: Wave {ii} of 1.
Direction: Bottom in wave {ii}.
Details: Looking for either continuation sideways in wave (b) of {ii} to then complete the correction lower in (c), or else we could already be in the making of wave (c).
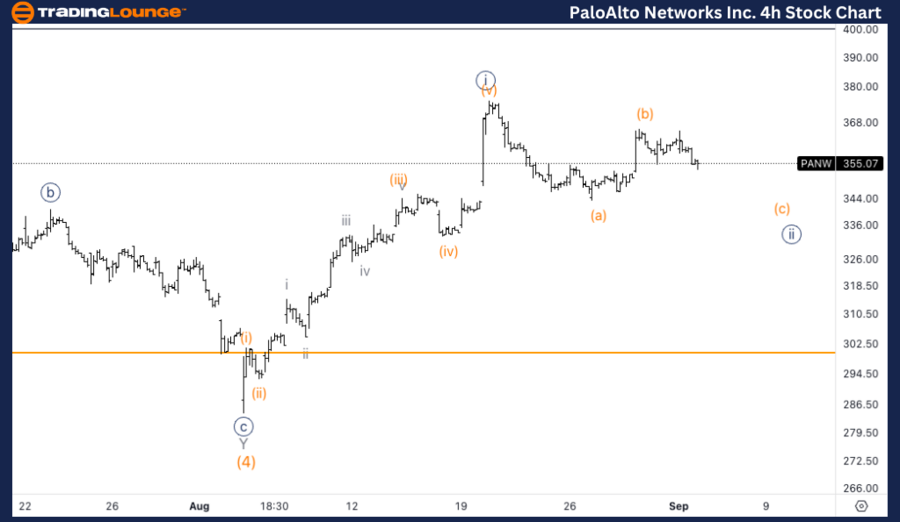
PANW Elliott Wave technical analysis – One-hour chart
The 1-hour chart suggests that PANW is currently in wave {ii} of 1, which is a corrective phase. There are two possible scenarios unfolding: either the stock continues to move sideways in wave (b) of {ii} before completing the correction lower in wave (c), or the correction in wave (c) is already underway. In either case, once wave {ii} completes, traders can expect a resumption of the uptrend in wave {iii} of 1.
This Elliott Wave analysis for Palo Alto Networks Inc. (PANW), evaluates the current wave structure and potential price movements on both the daily and 1-hour charts. The analysis focuses on identifying the wave positions and key levels that could inform trading strategies.
PaloAlto Networks Inc.(PANW) Elliott Wave technical analysis [Video]
Author

Peter Mathers
TradingLounge
Peter Mathers started actively trading in 1982. He began his career at Hoei and Shoin, a Japanese futures trading company.


