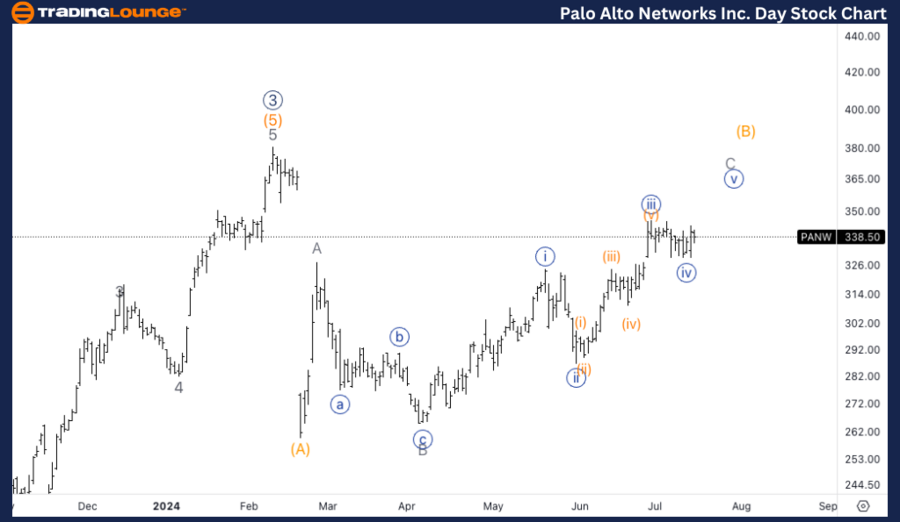
PANW Elliott Wave Analysis Trading Lounge Daily Chart,

Palo Alto Networks Inc.,( PANW) Daily Chart. 

PANW Elliott Wave technical analysis

Function: Counter Trend. 

Mode: Corrective. 

Structure: Flat. 

Position: Minor C.  

Direction: Top in wave C.   

Details: Looking for completion of Minor wave C to then continue lower in the overall correction in Primary wave 4. 

Chart

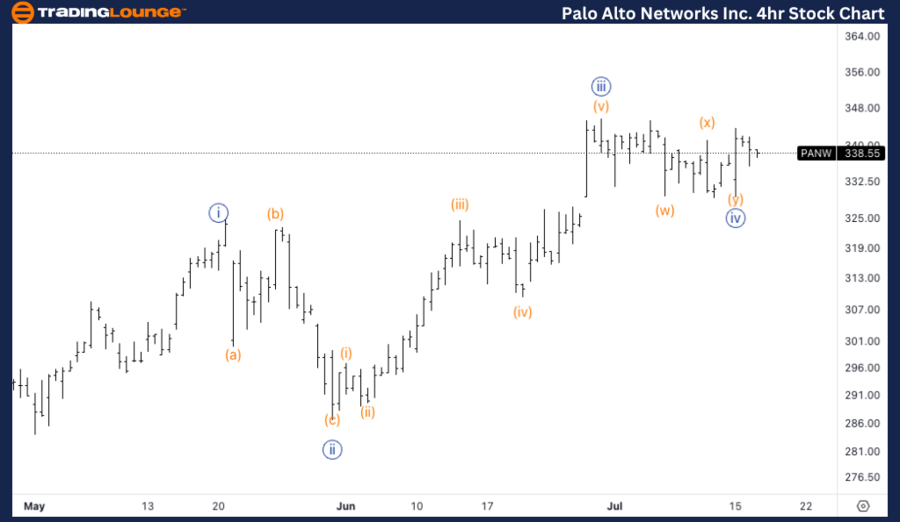
PANW Elliott Wave Analysis Trading Lounge 4Hr Chart,

Palo Alto Networks Inc., (PANW) 4Hr Chart. 

PANW Elliott Wave technical analysis

Function: Counter Trend. 

Mode: Corrective. 

Structure: Flat. 

Position: Wave {iv} of C.  

Direction: Upside in wave {v}. 

Details: Looking for another leg higher into wave {v} towards 350$, as we seem to be in a corrective mode in wave {iv}. 

Chart

Welcome to our latest Elliott Wave analysis for Palo Alto Networks Inc. (PANW). This analysis provides an in-depth look at PANW's price movements using the Elliott Wave Theory, helping traders identify potential opportunities based on current trends and market structure. We will cover insights from both the daily and 4-hour charts to offer a comprehensive perspective on PANW's market behavior.

PANW Elliott Wave technical analysis – Daily chart

The daily chart suggests that we are looking for the completion of Minor wave C, which would signify the end of the current corrective phase. Following this, we anticipate further downside movement as the overall correction in Primary wave 4 continues. Traders should be alert for signs of a top in wave C, which could indicate the resumption of the downtrend. 

PANW Elliott Wave technical analysis – Four-hour chart

The 4-hour chart indicates that we are currently in wave {iv} of C, which appears to be in a corrective mode. We expect another leg higher into wave {v}, targeting around $350. This upside move in wave {v} would likely complete the corrective phase before a potential resumption of the downtrend. 

Technical analyst: Alessio Barretta.

PANW Elliott Wave technical analysis [Video]

Share: Feed news

As with any investment opportunity there is a risk of making losses on investments that Trading Lounge expresses opinions on.

Historical results are no guarantee of future returns. Some investments are inherently riskier than others. At worst, you could lose your entire investment. TradingLounge™ uses a range of technical analysis tools, software and basic fundamental analysis as well as economic forecasts aimed at minimizing the potential for loss.

The advice we provide through our TradingLounge™ websites and our TradingLounge™ Membership has been prepared without considering your objectives, financial situation or needs. Reliance on such advice, information or data is at your own risk. The decision to trade and the method of trading is for you alone to decide. This information is of a general nature only, so you should, before acting upon any of the information or advice provided by us, consider the appropriateness of the advice considering your own objectives, financial situation or needs. Therefore, you should consult your financial advisor or accountant to determine whether trading in securities and derivatives products is appropriate for you considering your financial circumstances.

Recommended content


Recommended content

Editors’ Picks

EUR/USD rises toward 1.0950 amid intense USD selling

EUR/USD rises toward 1.0950 amid intense USD selling

EUR/USD is rising toward 1.0950 in Wednesday's European trading. The US Dollar resumes the downside amid heightened September Fed rate cut bets, supporting the pair. The focus remains on the mid-tier US data and Fedspeak 

EUR/USD News

GBP/USD scales fresh 2024 highs above 1.3000 after UK CPI data

GBP/USD scales fresh 2024 highs above 1.3000 after UK CPI data

GBP/USD trades above 1.3000, refreshing 2024 highs in the European session on Wednesday. The data from the UK showed that annual CPI inflation held steady at 2% in June. This reading alongside a broad US Dollar sell-off underpins the pair. 

GBP/USD News

USD/JPY tumbles to 156.00 amid risk-aversion, technical breakdown

USD/JPY tumbles to 156.00 amid risk-aversion, technical breakdown

USD/JPY is off the lows but under heavy selling pressure on the 156.00 level in European trading on Wednesday. Souring risk sentiment and a technical breakdown has fuelled the USD/JPY meltdown, as Japanese intervention risks loom. 

USD/JPY News

Gold rises on Kugler’s comments and Shanghai bets

Gold rises on Kugler’s comments and Shanghai bets

Gold is rising as expectations firm of falling interest rates in the US – a positive for the precious metal. Fed’s Adriana Kugler says a combination of falling inflation and weakening labor market could force rate cut “later this year”.

Gold News

Bitcoin rally catalyzes gains in Ethereum, Solana, and XRP, as traders digest Donald Trump incident

Bitcoin rally catalyzes gains in Ethereum, Solana, and XRP, as traders digest Donald Trump incident

Crypto market capitalization increased nearly 4% in the last 24 hours and climbed to $2.522 trillion on Wednesday, as seen on CoinGecko. Almost all cryptocurrencies ranked in the top 10 assets by market capitalization have rallied in that period.

Read more

Forex MAJORS

Cryptocurrencies

Signatures