|

Palladium Price Analysis: XPD/USD fades bounce off 50-DMA around $2,850

  • Palladium seesaws in a choppy range after bouncing off key DMA.
  • Bullish MACD, sustained trading beyond important support keeps buyers hopeful.
  • Ascending trend line from late January keeps buyers hopeful.

Palladium (XPD/USD) carries early Asian weakness around $2,851, down 0.22% intraday, ahead of Tuesday’s European session. In doing so, the commodity prices lack follow-through after bouncing off 50-DMA the previous day.

Even so, bullish MACD and sustained trading beyond crucial moving average favor XPD/USD bulls until the quote stay beyond $2,794 DMA support.

Following that, May’s low around $2,725 and late March tops near $2,685 could test the bears before directing them to an ascending support line from late January, surrounding $2550.

Alternatively, a daily closing beyond June’s high around $2,875 will aim for the $2,900 round figure and May 18 swing high close to $2,945.

However, sustained trading beyond $2,945 will help palladium bulls to aim for the $3,000 threshold before aiming for May’s top, also the record high, around $3,820.

Palladium: Daily chart
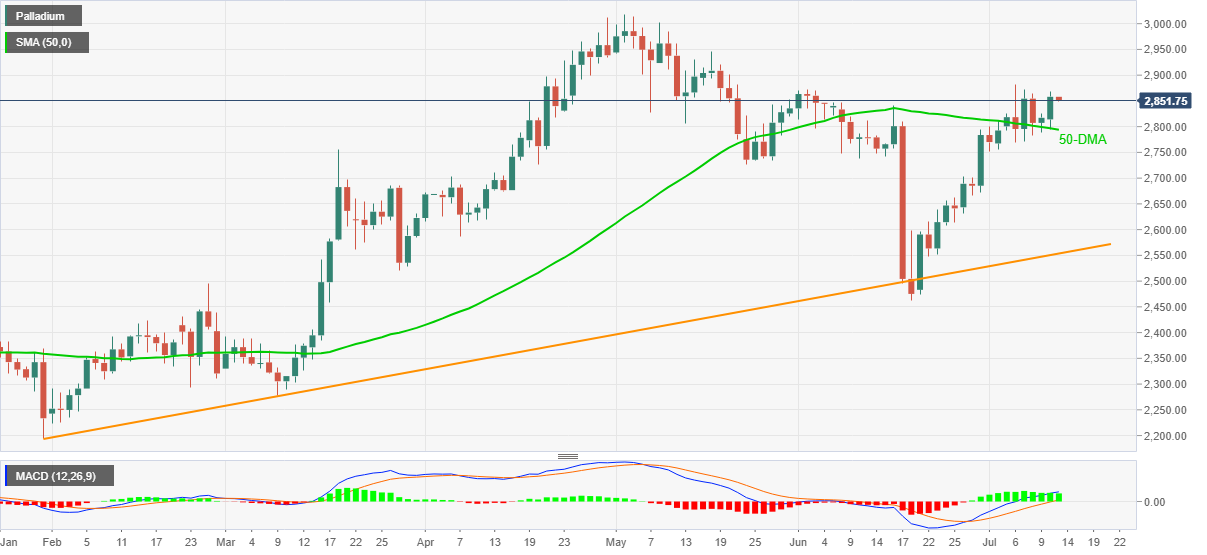
Trend: Bullish

Additional important levels

Overview
Today last price2851.63
Today Daily Change-6.36
Today Daily Change %-0.22%
Today daily open2857.99
 
Trends
Daily SMA202713.71
Daily SMA502796.78
Daily SMA1002704.79
Daily SMA2002529.27
 
Levels
Previous Daily High2867.88
Previous Daily Low2793.76
Previous Weekly High2882.78
Previous Weekly Low2769.1
Previous Monthly High2872.28
Previous Monthly Low2461.72
Daily Fibonacci 38.2%2839.57
Daily Fibonacci 61.8%2822.07
Daily Pivot Point S12811.87
Daily Pivot Point S22765.76
Daily Pivot Point S32737.75
Daily Pivot Point R12885.99
Daily Pivot Point R22914
Daily Pivot Point R32960.11

Author

Anil Panchal

Anil Panchal

FXStreet

Anil Panchal has nearly 15 years of experience in tracking financial markets. With a keen interest in macroeconomics, Anil aptly tracks global news/updates and stays well-informed about the global financial moves and their implications.

More from Anil Panchal
Share:

Editor's Picks

EUR/USD looks to regain the 200-day SMA

EUR/USD regains some balance and trade just above 1.1600 the figure ahead of the opening bell in Asia. The pair initially dipped to the 1.1530 zone for the first time since November, always following the stronger US Dollar and the marked flight-to-safety in the context of the ongoing Middle East crisis
 

GBP/USD attacks 1.3300, refreshing three-month lows

GBP/USD is deep in the red near 1.3300, accelerating its downside to renew three-month lows in European trading on Tuesday. The ongoing escalation in the Iran war, combined with rising Oil prices, weighs negatively on the higher-yielding Pound Sterling as the US Dollar capitalizes on increased haven demand.

Gold bounces off lows, back above $5,100

Gold remains on the defensive, eroding part of the recent multi-day advance and managing to trade back above the $5,100 mark per troy ounce on Tuesday. The precious metal initially dropped just below the critical $5,000 threshold on the back of the persistent strength of the Greenback, higher US Treasury yields across the curve and investors' repricing of Fed rate cuts.

XRP risks extending losses as US-Iran war rages on

Ripple (XRP) has come under pressure, drifting lower to $1.35 at the time of writing on Tuesday. The over 2% correction looks poised to erase the previous day’s gains, which lifted the remittance token to $1.42.

Energy shock 2.0: Why rising Gas prices could hit the Euro

Even without a confirmed, sustained disruption, the mere risk to a key global energy chokepoint is enough to inject a significant premium into European Gas markets. And for the Euro, that matters.

Ripple falters amid sell-off jitters and negative funding rates

Ripple (XRP) has come under pressure, drifting lower to $1.35 at the time of writing on Tuesday. The over 2% correction looks poised to erase the previous day’s gains, which lifted the remittance token to $1.42.