Palladium Price Analysis: XPD/USD bulls battle support-turned-resistance around $2,500


  • Palladium revisits 200-DMA, five-month-old trend line on a bounce from three-month low.
  • Bearish MACD, strong upside hurdles and US dollar strength probe the buyers.
  • Horizontal area from November 2020 adds to the upside filters, sellers brace for a bumpy road ahead.

Palladium (XPD/USD) consolidates recent losses below $2,500, up 0.82% intraday near $2,495 ahead of Monday’s European session. In doing so, the bright metal keeps the bounce off March 17 lows, flashed the previous day, to battle a convergence of 200-day SMA and previous support line.

Given the strongest bearish bias of the MACD in 15 months, coupled with the sustained trading below the key levels, palladium prices are likely to remain pressured toward the late November 2020 tops surrounding $2,435.

It’s worth noting that there are multiple supports around $2,350 and the $,2300 threshold before dragging the quote to March’s low of $2277 during the commodity’s further weakness.

Alternatively, a clear upside break of $2,500-05 resistance confluence, previous support, won’t offer a free pass to the buyers as a seven-month-old horizontal hurdle around $2,520-30 becomes a tough nut to crack for palladium buyers.

Even if the precious metal prices cross the $2,530 hurdle, there are multiple hurdles around $2,575 and $2,685-90 before highlighting May’s low of $2,725 for the bulls.

To sum up, Palladium bears seem to take a breather but aren’t out of the woods.

Palladium daily chart
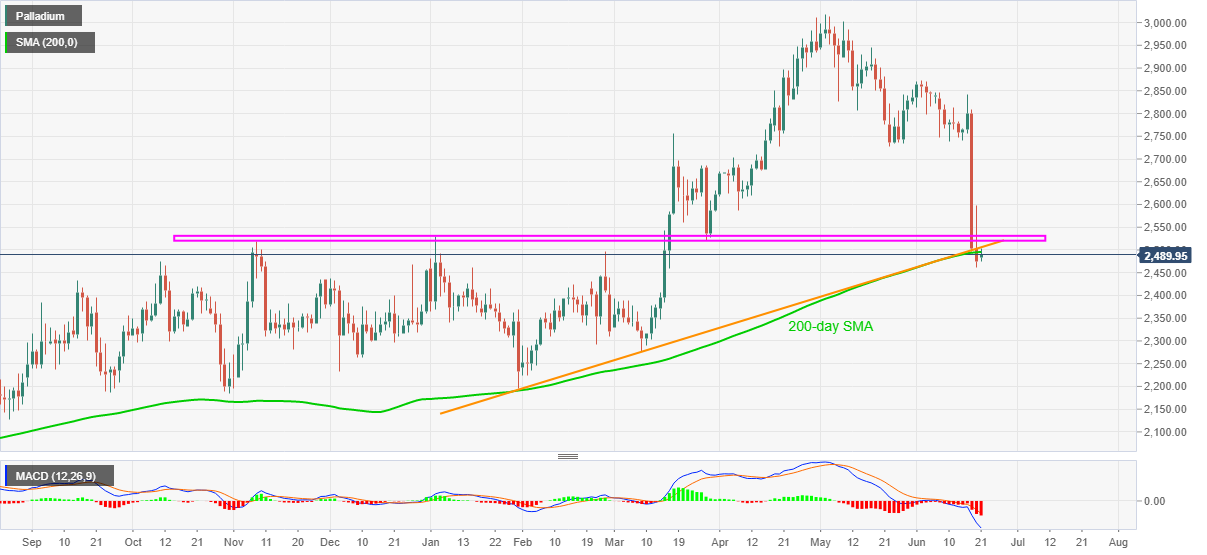
Trend: Bearish

Additional important levels

Overview
Today last price 2495.83
Today Daily Change 20.66
Today Daily Change % 0.83%
Today daily open 2475.17
 
Trends
Daily SMA20 2771.04
Daily SMA50 2830.05
Daily SMA100 2642.52
Daily SMA200 2494.84
 
Levels
Previous Daily High 2598.38
Previous Daily Low 2461.72
Previous Weekly High 2841.3
Previous Weekly Low 2461.72
Previous Monthly High 3018.8
Previous Monthly Low 2726.52
Daily Fibonacci 38.2% 2513.92
Daily Fibonacci 61.8% 2546.18
Daily Pivot Point S1 2425.13
Daily Pivot Point S2 2375.1
Daily Pivot Point S3 2288.47
Daily Pivot Point R1 2561.79
Daily Pivot Point R2 2648.42
Daily Pivot Point R3 2698.45


Share: Feed news

Information on these pages contains forward-looking statements that involve risks and uncertainties. Markets and instruments profiled on this page are for informational purposes only and should not in any way come across as a recommendation to buy or sell in these assets. You should do your own thorough research before making any investment decisions. FXStreet does not in any way guarantee that this information is free from mistakes, errors, or material misstatements. It also does not guarantee that this information is of a timely nature. Investing in Open Markets involves a great deal of risk, including the loss of all or a portion of your investment, as well as emotional distress. All risks, losses and costs associated with investing, including total loss of principal, are your responsibility. The views and opinions expressed in this article are those of the authors and do not necessarily reflect the official policy or position of FXStreet nor its advertisers. The author will not be held responsible for information that is found at the end of links posted on this page.

If not otherwise explicitly mentioned in the body of the article, at the time of writing, the author has no position in any stock mentioned in this article and no business relationship with any company mentioned. The author has not received compensation for writing this article, other than from FXStreet.

FXStreet and the author do not provide personalized recommendations. The author makes no representations as to the accuracy, completeness, or suitability of this information. FXStreet and the author will not be liable for any errors, omissions or any losses, injuries or damages arising from this information and its display or use. Errors and omissions excepted.

The author and FXStreet are not registered investment advisors and nothing in this article is intended to be investment advice.

Recommended content


Recommended content

Editors’ Picks

EUR/USD stays in positive territory above 1.0850 after US data

EUR/USD stays in positive territory above 1.0850 after US data

EUR/USD clings to modest daily gains above 1.0850 in the second half of the day on Friday. The improving risk mood makes it difficult for the US Dollar to hold its ground after PCE inflation data, helping the pair edge higher ahead of the weekend.

EUR/USD News

GBP/USD stabilizes above 1.2850 as risk mood improves

GBP/USD stabilizes above 1.2850 as risk mood improves

GBP/USD maintains recovery momentum and fluctuates above 1.2850 in the American session on Friday. The positive shift seen in risk mood doesn't allow the US Dollar to preserve its strength and supports the pair.

GBP/USD News

Gold rebounds above $2,380 as US yields stretch lower

Gold rebounds above $2,380 as US yields stretch lower

Following a quiet European session, Gold gathers bullish momentum and trades decisively higher on the day above $2,380. The benchmark 10-year US Treasury bond yield loses more than 1% on the day after US PCE inflation data, fuelling XAU/USD's upside.

Gold News

Avalanche price sets for a rally following retest of key support level

Avalanche price sets for a rally following retest of  key support level

Avalanche (AVAX) price bounced off the $26.34 support level to trade at $27.95 as of Friday. Growing on-chain development activity indicates a potential bullish move in the coming days.

Read more

The election, Trump's Dollar policy, and the future of the Yen

The election, Trump's Dollar policy, and the future of the Yen

After an assassination attempt on former President Donald Trump and drop out of President Biden, Kamala Harris has been endorsed as the Democratic candidate to compete against Trump in the upcoming November US presidential election.

Read more

Forex MAJORS

Cryptocurrencies

Signatures