![]() Elliott Wave Forecast Team
Elliott Wave Forecast Team
ElliottWave-Forecast.com
Palantir Technologies (PLTR), Inc. is a holding company, which engages in the development of data integration and software solutions. It operates through the Commercial and Government segments. The Commercial segment offers services to clients in the private sector. The Government segment provides solutions to the United States (US) federal government and non- US governments. The firm offers automotive, financial compliance, legal intelligence, mergers and acquisitions solutions.
In January 2021, Palantir made an important peak at 45.00 and it has been going down ever since. We could see 5 waves clearly from the top and we labeled as wave “a” ending at 17.09, more than 50% in losses. After that, PLTR bounce in 3 waves above of 38.2% Fibonacci retracement of wave “a” and resume to the downside. This correction ended at 29.29 dollars and we labeled as wave “b”. The next structure lower as wave “c” has ended with 5 swings lower to complete a zig zag correction from January 2021 peak as wave (II). This wave “c” ended at 5.97 and bounce. (If you want to learn more about Elliott Wave Theory, please follow these links: Elliott Wave Education and Elliott Wave Theory).
Palantir ($PLTR) daily chart April 03 2023
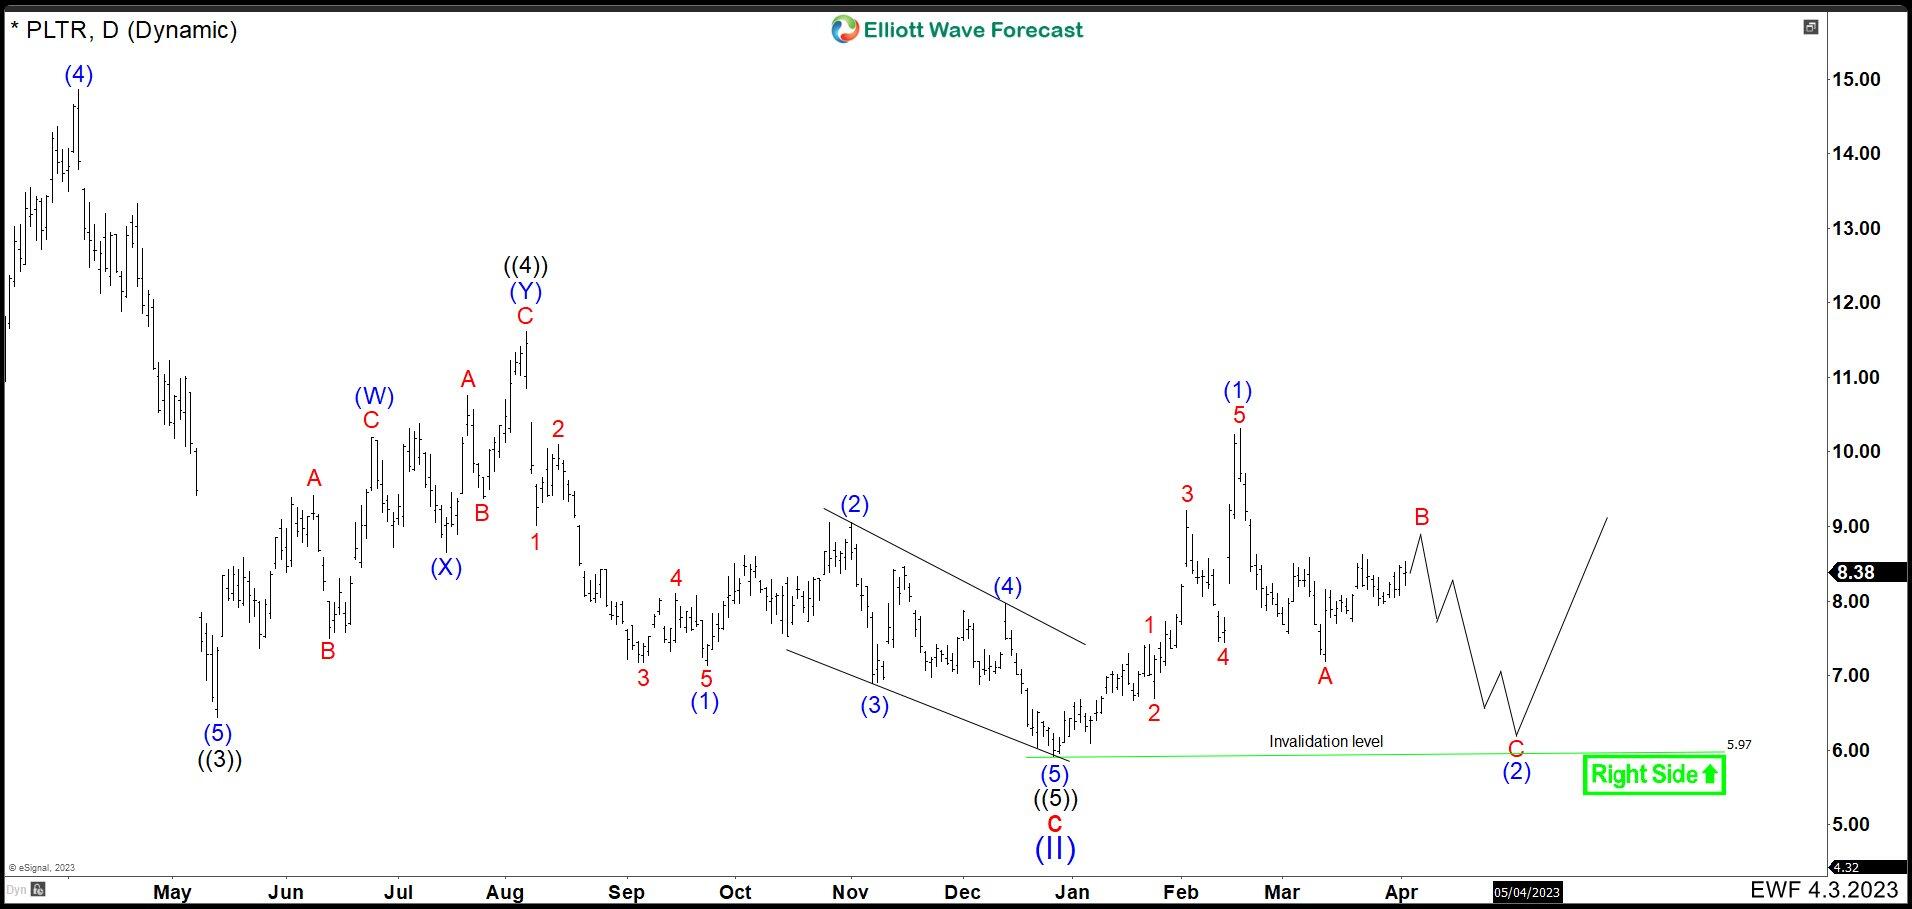
In the chart above, we can see how wave ((3)) of “c” ended at 6.44. A bounce took a part doing a double correction structure (W), (X) and (Y), ending wave ((4)) at 11.63. PLTR continued lower building a structure and we labeled as a ending diagonal to complete wave ((5)) of c of (II) at 5.97. As the structure from 11.63 high is not clear, this also could be a wave (B) of a flat correction for wave ((4)). Inclusive the whole move to 5.97 could be a wave (1) of a bigger ending diagonal as wave ((5)). Either way, we will know that if market breaks below 5.97. PLTR jump from 5.97 developing 5 swings higher and we labeled as a impulse wave (1) at 10.31. Then market dropped in 3 swings and we called wave A of (2) at 7.18. We are expecting that the stock price continue higher to complete wave B before resuming lower. The last swing lower as wave C of (2) must end above 5.97 to validate the count. A break below 5.97, we will consider that wave ((4)) was a flat correction or we are in ending diagonal as wave ((5)). This means that PALANTIR should continue sideways to lower until completing the bearish cycle and start a new rally.
Palantir ($PLTR) daily chart April 03 2023 alternative
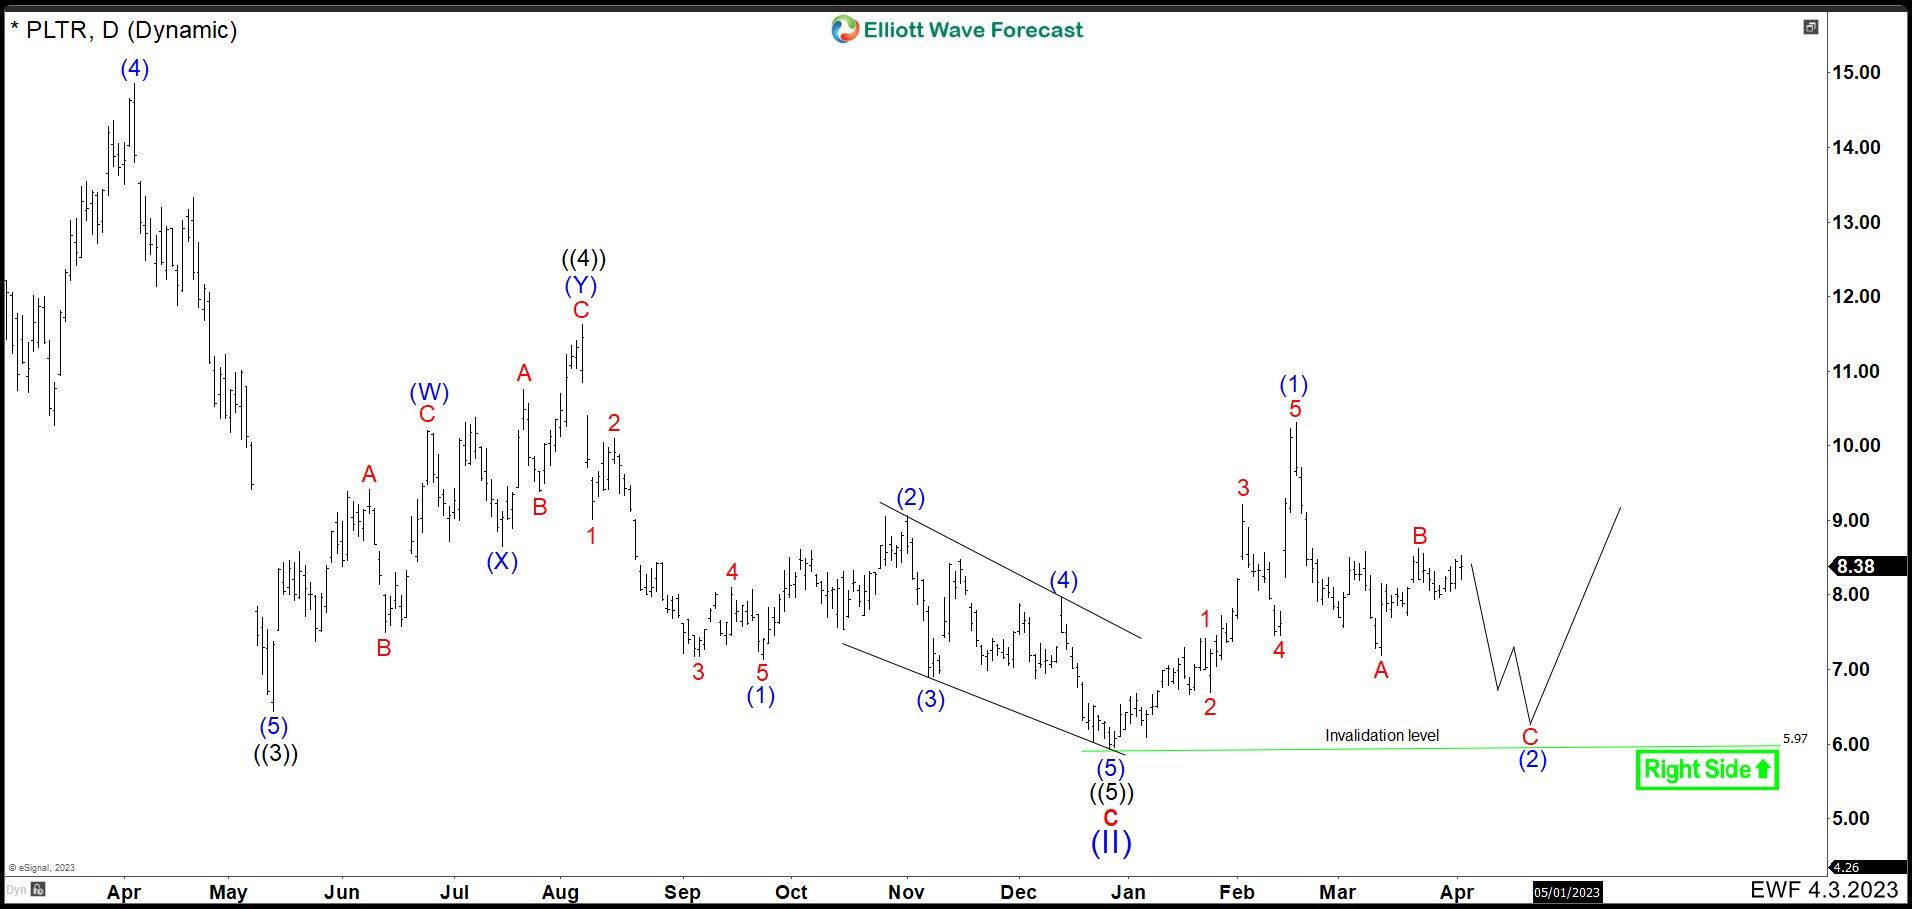 As alternative view to the count, wave B could be done already at 8.64 and continue lower in wave C. This view is very easy to invalidate breaking above 8.64 and in that case, PLTR would be up in wave B as the first chart. Another possibility is that wave (2) could be done at 7.18 and the market just continue higher. We are not consider this view because the world indices are still in correction mode and we should expect more downside to come. The question is if Palantir could break 5.97 or not.
FURTHER DISCLOSURES AND DISCLAIMER CONCERNING RISK, RESPONSIBILITY AND LIABILITY Trading in the Foreign Exchange market is a challenging opportunity where above average returns are available for educated and experienced investors who are willing to take above average risk. However, before deciding to participate in Foreign Exchange (FX) trading, you should carefully consider your investment objectives, level of xperience and risk appetite. Do not invest or trade capital you cannot afford to lose. EME PROCESSING AND CONSULTING, LLC, THEIR REPRESENTATIVES, AND ANYONE WORKING FOR OR WITHIN WWW.ELLIOTTWAVE- FORECAST.COM is not responsible for any loss from any form of distributed advice, signal, analysis, or content. Again, we fully DISCLOSE to the Subscriber base that the Service as a whole, the individual Parties, Representatives, or owners shall not be liable to any and all Subscribers for any losses or damages as a result of any action taken by the Subscriber from any trade idea or signal posted on the website(s) distributed through any form of social-media, email, the website, and/or any other electronic, written, verbal, or future form of communication . All analysis, trading signals, trading recommendations, all charts, communicated interpretations of the wave counts, and all content from any media form produced by www.Elliottwave-forecast.com and/or the Representatives are solely the opinions and best efforts of the respective author(s). In general Forex instruments are highly leveraged, and traders can lose some or all of their initial margin funds. All content provided by www.Elliottwave-forecast.com is expressed in good faith and is intended to help Subscribers succeed in the marketplace, but it is never guaranteed. There is no “holy grail” to trading or forecasting the market and we are wrong sometimes like everyone else. Please understand and accept the risk involved when making any trading and/or investment decision. UNDERSTAND that all the content we provide is protected through copyright of EME PROCESSING AND CONSULTING, LLC. It is illegal to disseminate in any form of communication any part or all of our proprietary information without specific authorization. UNDERSTAND that you also agree to not allow persons that are not PAID SUBSCRIBERS to view any of the content not released publicly. IF YOU ARE FOUND TO BE IN VIOLATION OF THESE RESTRICTIONS you or your firm (as the Subscriber) will be charged fully with no discount for one year subscription to our Premium Plus Plan at $1,799.88 for EACH person or firm who received any of our content illegally through the respected intermediary’s (Subscriber in violation of terms) channel(s) of communication.
Recommended content
Editors’ Picks

EUR/USD rises toward 1.0500 ahead of US data
EUR/USD finds a foothold in the second half of the day on Tuesday and rises toward 1.0500. The modest selling pressure surrounding the US Dollar helps the pair edge higher as investors await February Consumer Confidence Index data from the US.

GBP/USD regains traction, rises above 1.2650
GBP/USD gathers bullish momentum and trades above 1.2650 after declining toward 1.2600 earlier in the day. Market attention shifts to BoE Chief Economist Pill's speech and US Consumer Confidence data for further impetus.

Gold extends correction toward $2,930
Gold stays under modest bearish pressure and declines toward $2,930. US President Donald Trump is expected to sign new executive orders following the news of his administration seeking to toughen semiconductor restrictions on China.

Bitcoin edges below $90,000, ending its long streak of consolidation
Bitcoin (BTC) continues to trade in red, reaching a low of $88,200 during Tuesday’s early Europen trading session and hitting the lowest level since mid-November after falling 4.89% the previous day.

Five fundamentals for the week: Fallout from German vote, Fed's favorite figure stand out Premium
Statements, not facts, are set to dominate the last week of February. Further fallout from Germany's elections and new comments from Trump on trade may overshadow most figures –but not the Fed's favorite inflation figure.

The Best brokers to trade EUR/USD
SPONSORED Discover the top brokers for trading EUR/USD in 2025. Our list features brokers with competitive spreads, fast execution, and powerful platforms. Whether you're a beginner or an expert, find the right partner to navigate the dynamic Forex market.