|

Oil technical analysis: WTI edges lower despite bullish EIA data, now trading below 56.00 a barrel

  • WTI erases daily gains after EIA-inspired spike. 
  • The level to beat for bears is $55.40 a barrel.
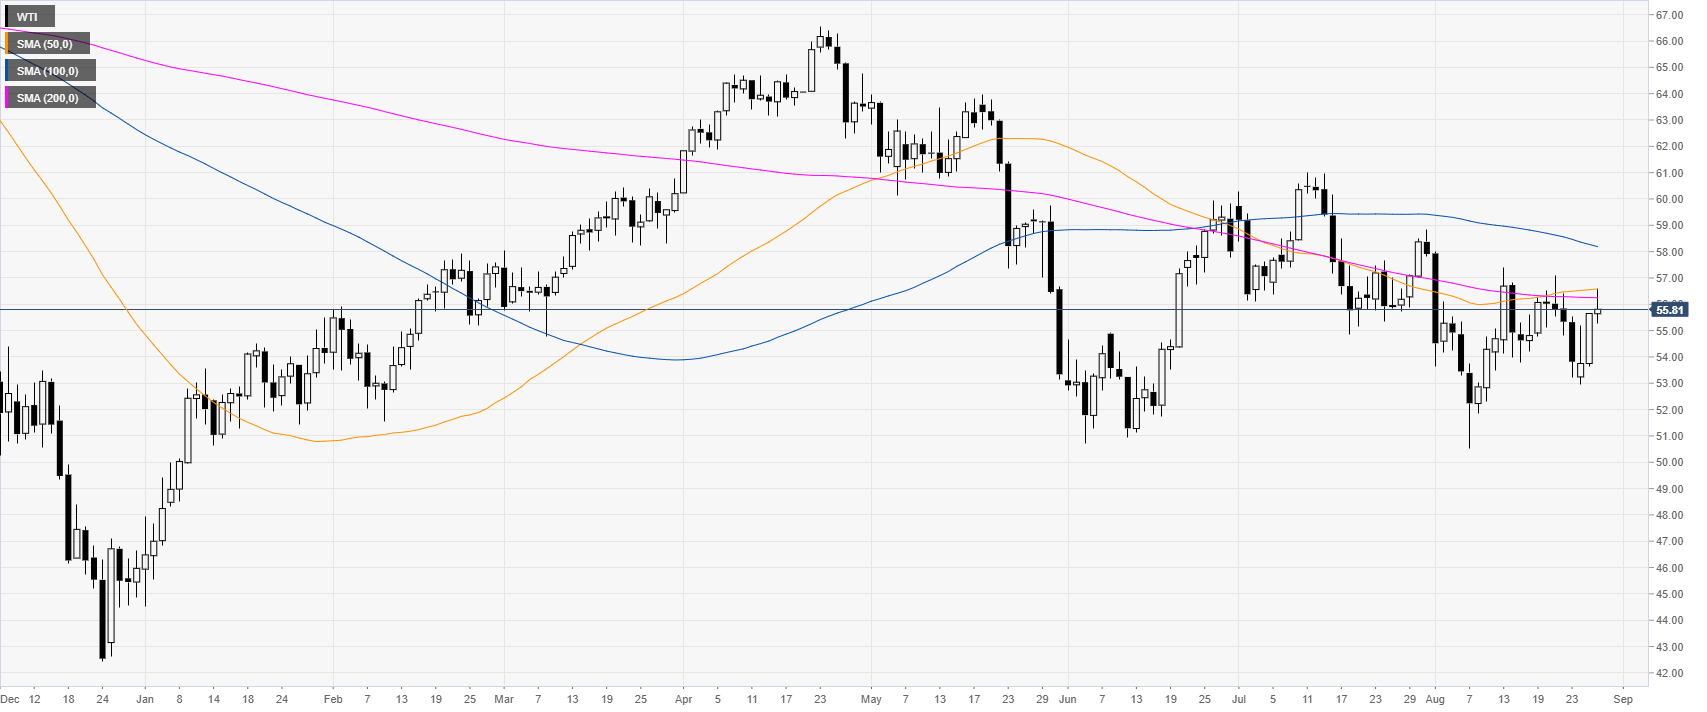
 

Oil daily chart

 
WTI (West Texas Intermediate) traded as high as $56.59 a barrel near the 50/200-daily simple moving averages (SMAs) but the market found no acceptance above that level. Oil is trading below its main SMAs, suggesting an overall bearish bias.
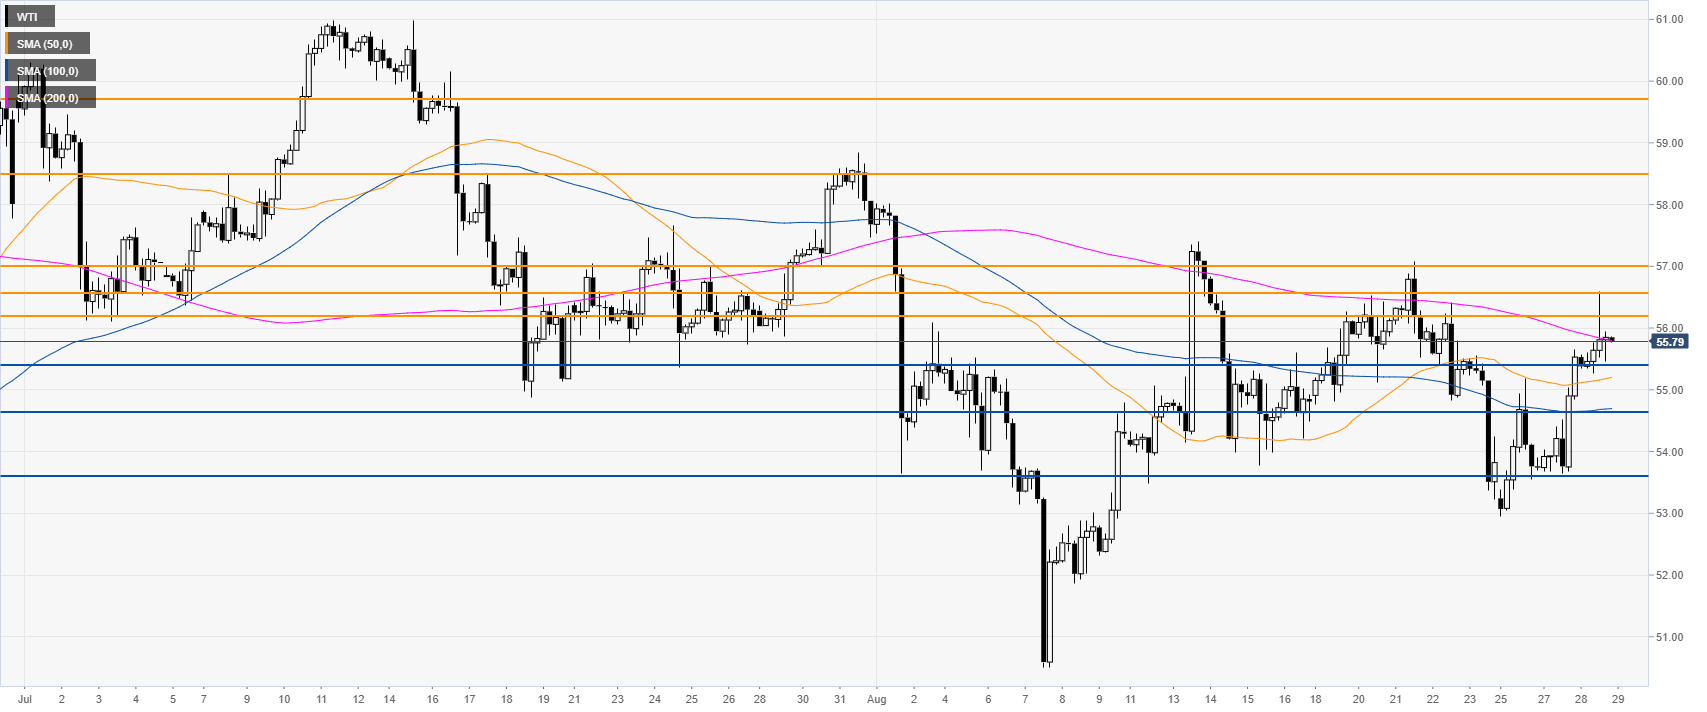
Oil 4-hour chart

 
WTI is trading below 65.20 resistance and the 200 SMA suggesting bearish momentum in the medium term. Bears would need to initially break below the 55.40 level to reach 54.65 and 53.60 on the way down.
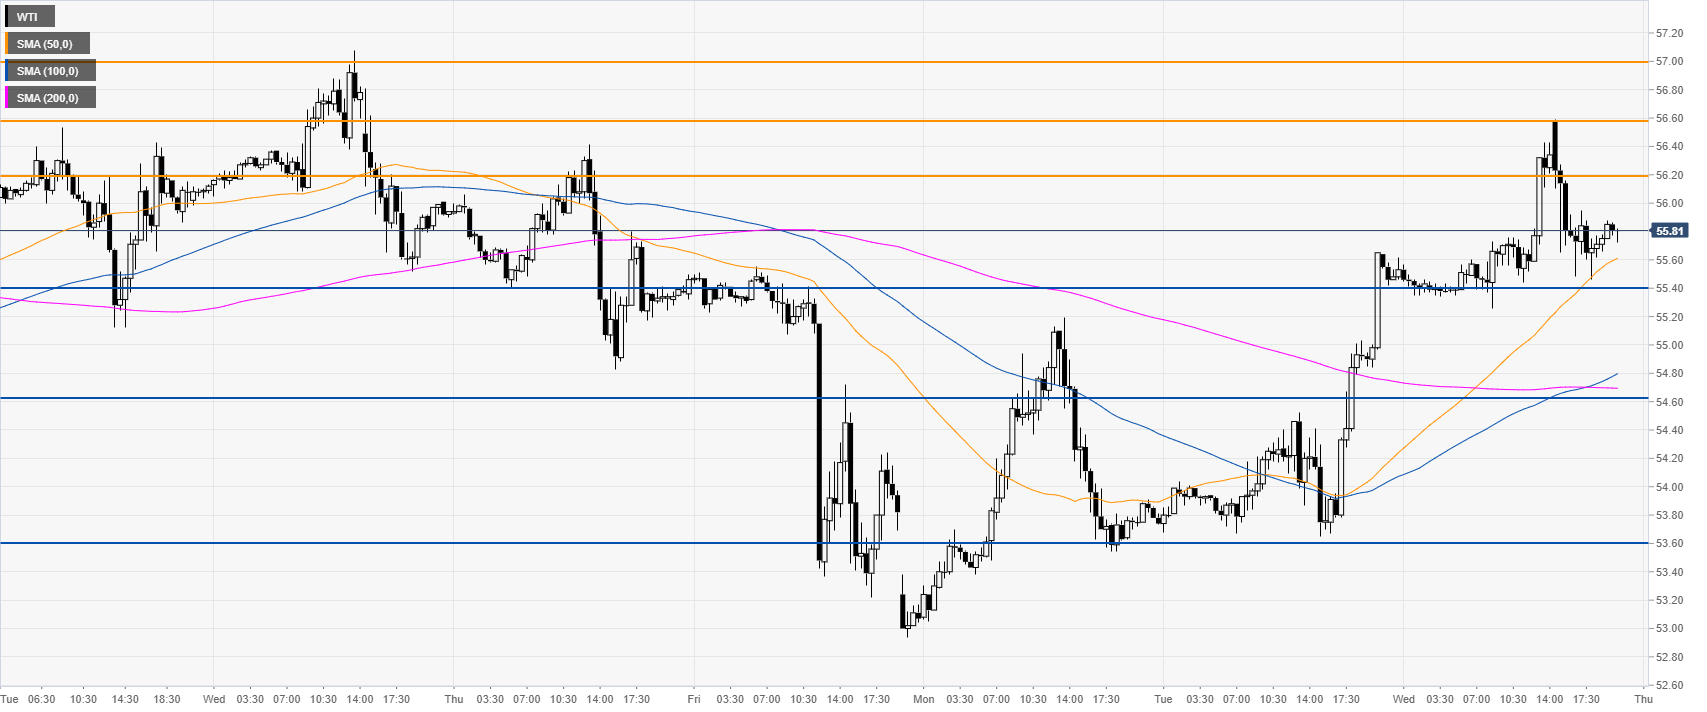
Oil 30-minute chart

 
Oil is trading above its main SMAs, suggesting bullish momentum in the near term. Black gold could find immediate resistance at the 56.20, 56.50 and 57.00 levels. In the New York session, the EIA reported a draw of -10.027M vs. -2.112M expected. The market initially spiked up on the bullish news but then the sellers stepped in and drove the market below the 56.00 figure.
 

Additional key levels

WTI

Overview
Today last price55.81
Today Daily Change0.16
Today Daily Change %0.29
Today daily open55.65
 
Trends
Daily SMA2054.89
Daily SMA5056.55
Daily SMA10058.27
Daily SMA20056.19
Levels
Previous Daily High55.65
Previous Daily Low53.65
Previous Weekly High57.08
Previous Weekly Low53.22
Previous Monthly High60.99
Previous Monthly Low54.87
Daily Fibonacci 38.2%54.89
Daily Fibonacci 61.8%54.41
Daily Pivot Point S154.32
Daily Pivot Point S252.98
Daily Pivot Point S352.32
Daily Pivot Point R156.32
Daily Pivot Point R256.98
Daily Pivot Point R358.32

Author

Flavio Tosti

Flavio Tosti

Independent Analyst


More from Flavio Tosti
Share:

Editor's Picks

EUR/USD hovers around 1.1850 ahead of FOMC Minutes

EUR/USD stays on the back foot around 1.1850 in the European session on Wednesday, pressured by renewed US Dollar demand. Traders now look forward to the Minutes of the Fed's January monetary policy meeting for fresh signals on future rate cuts. 

GBP/USD defends 1.3550 after UK inflation data

GBP/USD is holding above 1.3550 in Wednesday's European morning, little changed following the UK Consumer Price Index (CPI) data release. The UK inflation eased as expected in January, reaffirming bets for a March BoE interest rate cut, especially after Tuesday's weak employment report. 

Gold: Is the $5,000 level back in sight?

Gold snaps a two-day downtrend, as recovery gathers traction toward $5,000 on Wednesday. The US Dollar recovers from the overnight sell-off as rebalancing trades resume ahead of Fed Minutes. The 38.2% Fib support holds on the daily chart for now. What does that mean for Gold?

Pi Network rally defies market pressure ahead of its first anniversary

Pi Network is trading above $0.1900 at press time on Wednesday, extending the weekly gains by nearly 8% so far. The steady recovery is supported by a short-term pause in mainnet migration, which reduces pressure on the PI token supply for Centralized Exchanges. The technical outlook focuses on the $0.1919 resistance as bullish momentum increases.

UK jobs market weakens, bolstering rate cut hopes

In the UK, the latest jobs report made for difficult reading. Nonetheless, this represents yet another reminder for the Bank of England that they need to act swiftly given the collapse in inflation expected over the coming months. 

Top 3 Price Prediction: Bitcoin, Ethereum, and Ripple face downside risk as bears regain control

Bitcoin, Ethereum, and Ripple remain under pressure on Wednesday, with the broader trend still sideways. BTC is edging below $68,000, nearing the lower consolidating boundary, while ETH and XRP also declined slightly, approaching their key supports.