Oil stocks broke above important resistances, hitting a fresh multi-year peak. Is this the end of the bears?
Technical picture of the XOI
In recent days crude oil reversed and jumped above the early March peaks, breaking above the barrier of $80. Earlier this week, the S&P500 moved above 5200 and hit a fresh peak during yesterday’s session. What happened at the same time with oil stocks? In today’s article, we’ll take a look at the current technical situation and shed some light on the potential threats that may impact oil bulls in the coming week. Have a nice read!
Let’s start today’s analysis with the medium-term chart.
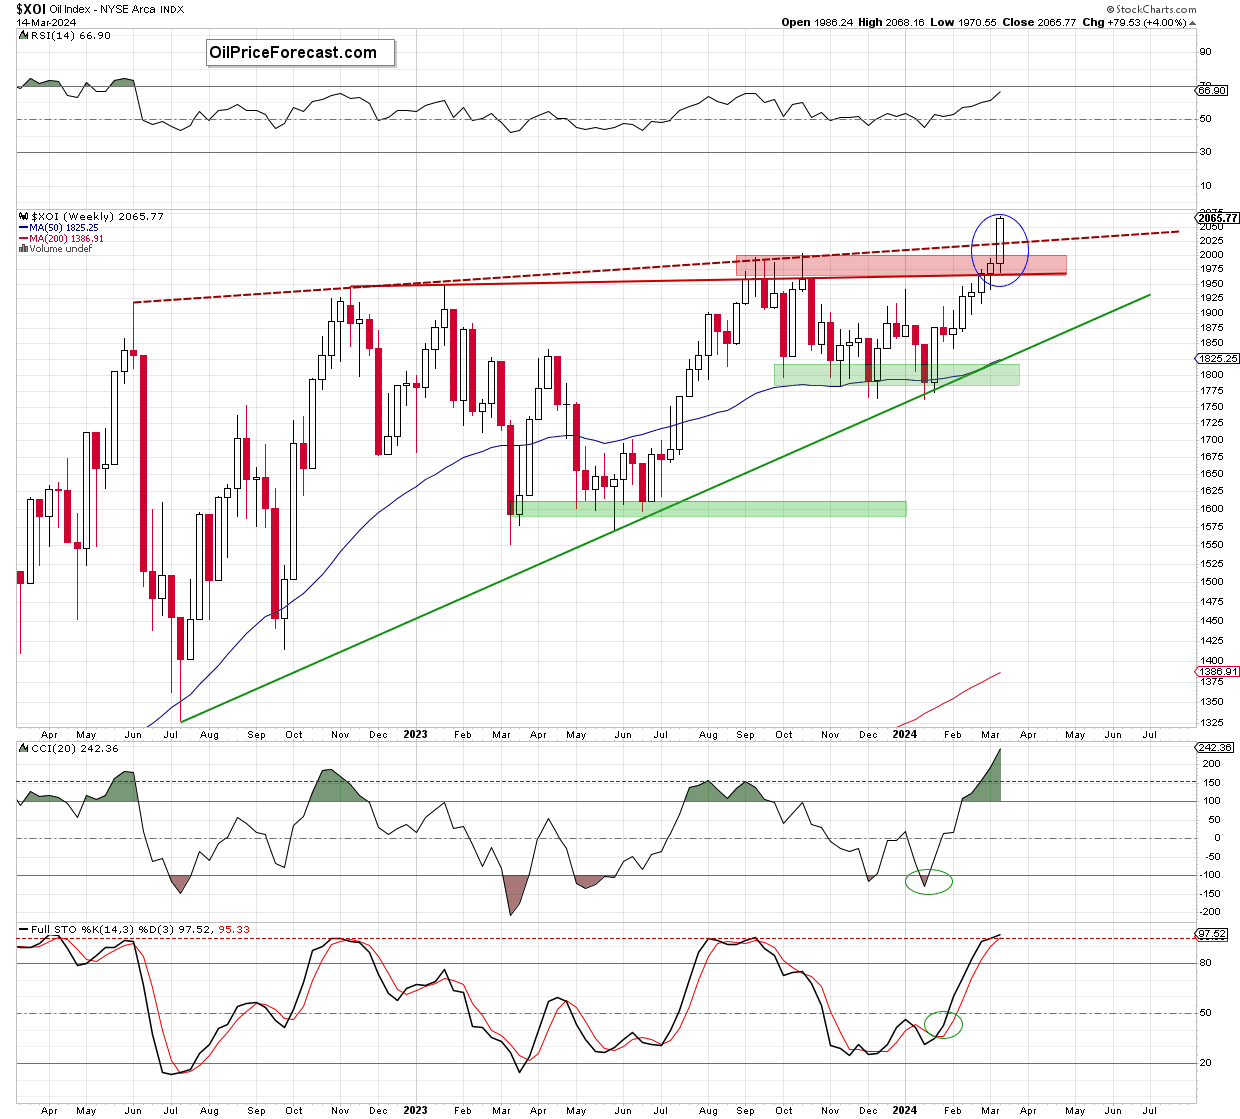
From this perspective, we see that the XOI broke not only above the red resistance line based on late 2022 and early 2023 peaks (which was strong enough to keep gains in check in Sep. and Oct. 2023), the red resistance zone created by the previous highs, but also above the red dashed resistance line based on even earlier peaks.
Thanks to these positive developments, a big white candle was formed on the chart, but…. we should keep in mind that the week is not over yet.
Is there anything that could stop Oil bulls?
Let’s examine the monthly chart to find out.
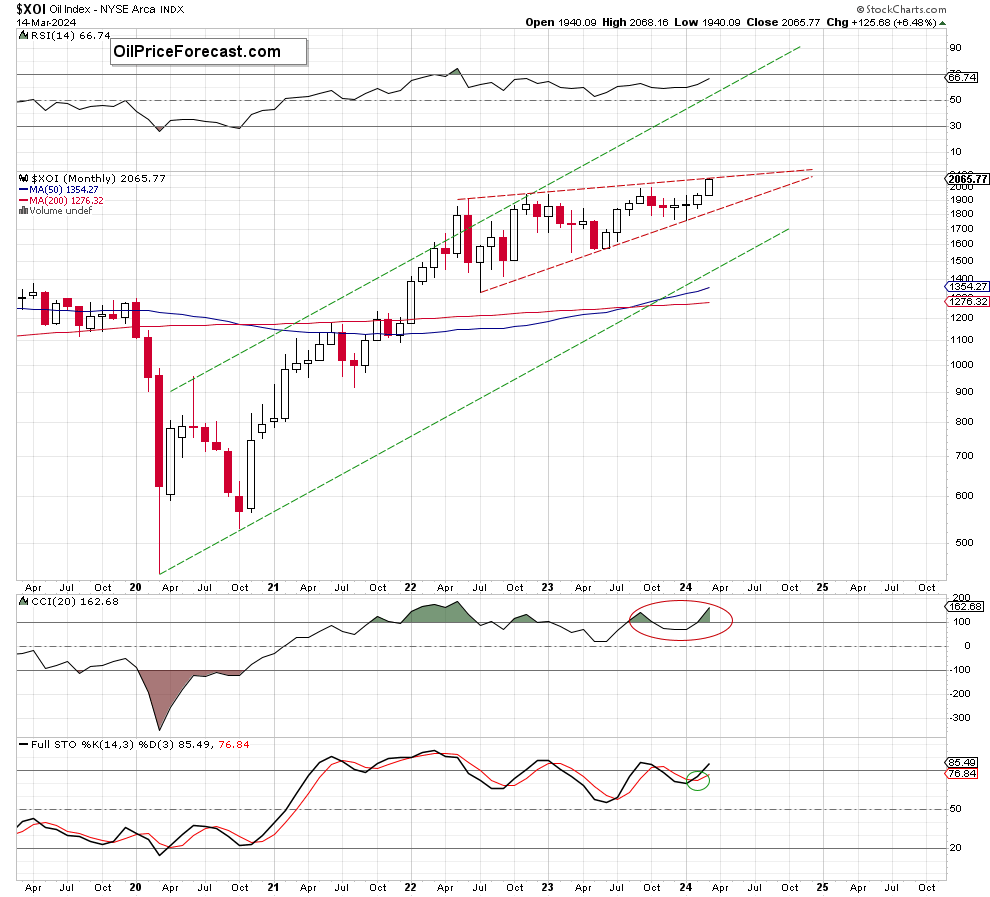
When we take a look at the oil stocks index from the broader perspective, we see that the XOI climbed to the upper border of the red rising wedge, which could encourage the sellers to check their opponents’ determination to fight for higher values of the index – especially when we mix this picture with the current situation in the short term.
What do I mean by that?
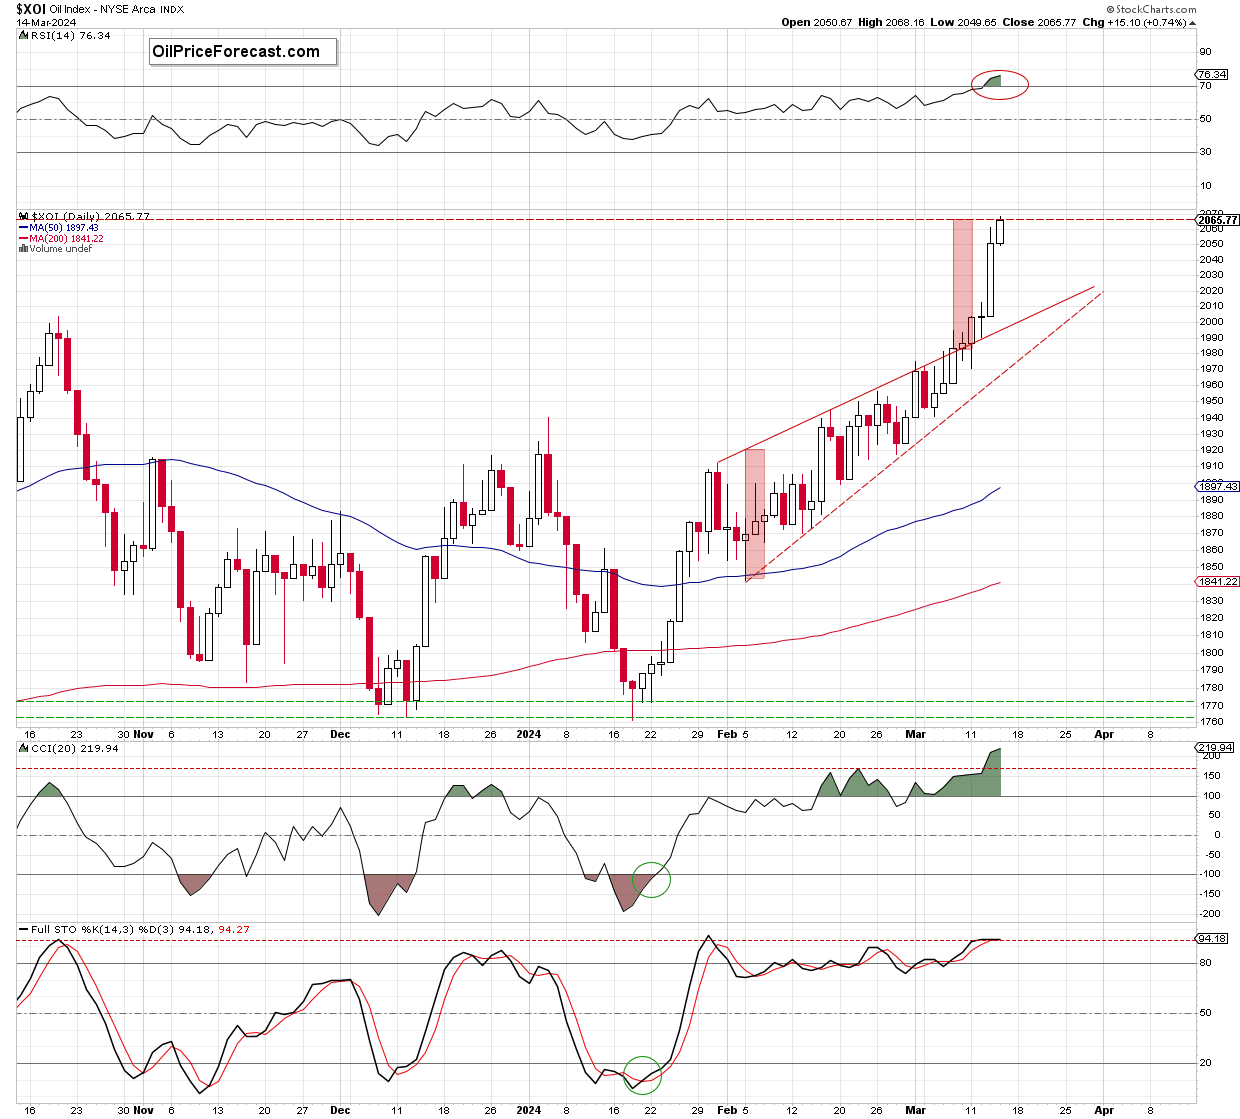
Looking at the daily chart, we see that oil stocks broke above the upper line of the red rising wedge, triggering further improvement in the following days.
Thanks to the buyers’ activity, the XOI broke above 2,000 and hit a fresh multi-year high of 2,068.16 during yesterday’s session. In this way, oil stocks moved to the area where the size of the upward move corresponded to the height of the red rising wedge (marked with the red rectangles), which could encourage the bears to show their claws and trigger a reversal in the very near future – especially when we factor in the above-mentioned upper border of the bigger and wider rising wedge marked on the long-term chart.
Nevertheless, in my opinion, as long as the XOI remains above the resistances marked on the weekly chart (especially the red zone based on the previous peaks), a bigger move to the downside is not a sure bet, and all downswings would be nothing more than verifications of the earlier breakout.
Summing up, the XOI broke above important resistances and hit a fresh multi-year high. However, taking into account the long-term resistance that emerged from the monthly chart and the fact that the current upward move is equal to the height of the rising wedge (marked on the daily chart), I think it is worth being more attentive to the current levels and carefully observing the behavior of market participants, because any signs of bullish weakness can be quickly exploited by their rivals to bring the index back to last year's peaks.
Want free follow-ups to the above article and details not available to 99%+ investors? Sign up to our free newsletter today!
All essays, research and information found above represent analyses and opinions of Przemyslaw Radomski, CFA and Sunshine Profits' employees and associates only. As such, it may prove wrong and be a subject to change without notice. Opinions and analyses were based on data available to authors of respective essays at the time of writing. Although the information provided above is based on careful research and sources that are believed to be accurate, Przemyslaw Radomski, CFA and his associates do not guarantee the accuracy or thoroughness of the data or information reported. The opinions published above are neither an offer nor a recommendation to purchase or sell any securities. Mr. Radomski is not a Registered Securities Advisor. By reading Przemyslaw Radomski's, CFA reports you fully agree that he will not be held responsible or liable for any decisions you make regarding any information provided in these reports. Investing, trading and speculation in any financial markets may involve high risk of loss. Przemyslaw Radomski, CFA, Sunshine Profits' employees and affiliates as well as members of their families may have a short or long position in any securities, including those mentioned in any of the reports or essays, and may make additional purchases and/or sales of those securities without notice.
Recommended content
Editors’ Picks

EUR/USD resumes slide below 1.0500
EUR/USD gained modest upward traction ahead of Wall Street's opening but resumed its slide afterwards. The pair is under pressure in the American session and poised to close the week with losses near its weekly low at 1.0452.

GBP/USD nears 1.2600 as the US Dollar regains its poise
Disappointing macroeconomic data releases from the UK put pressure on the British Pound, yet financial markets are all about the US Dollar ahead of the weekly close. Demand for the Greenback increased in the American session, pushing GBP/USD towards 1.2600.

Gold pierces $2,660, upside remains capped
Gold (XAU/USD) puts pressure on daily lows and trades below $2,660 on Friday’s early American session. The US Dollar (USD) reclaims its leadership ahead of the weekly close, helped by rising US Treasury yields.
Broadcom is the newest trillion-dollar company Premium
Broadcom (AVGO) stock surged more than 21% on Friday morning after management estimated on Thursday’s earnings call that the market for customized AI accelerators might reach $90 billion in fiscal year 2027.

Can markets keep conquering record highs?
Equity markets are charging to new record highs, with the S&P 500 up 28% year-to-date and the NASDAQ Composite crossing the key 20,000 mark, up 34% this year. The rally is underpinned by a potent mix of drivers.

Best Forex Brokers with Low Spreads
VERIFIED Low spreads are crucial for reducing trading costs. Explore top Forex brokers offering competitive spreads and high leverage. Compare options for EUR/USD, GBP/USD, USD/JPY, and Gold.


