Oil trades at minor loss with traders unsure how to price in sluggish demand outlook against US drawdowns
- Oil price trades lower again after snapping a four-day winning streak on Tuesday.
- Traders saw a chunky overnight drawdown of 5.2 million barrels from the US American Petroleum Institute.
- The US Dollar Index weakens ahead of the US CPI release.

Oil dips lower as selling pressure is visible on the chart with more downside in crude prices possible after the price action underwent a firm rejection at the 100-day Simple Moving Average (SMA) at $78.50. The chunky drawdown of 5.2 million barrels reported by the American Petroleum Institute (API) was able to give some counterweight to the selling pressure from Tuesday, though not enough to hold. The initial sell-off took place after the release of the Producer Price Index (PPI), which came in substantially softer than markets expected, jacking up expectations of another soft reading for the US Consumer Price Index (CPI) later today.
The US Dollar Index (DXY), which tracks the performance of the US Dollar against six major currencies, faces selling pressure as well. The US CPI release for July is likely the most important data release for the week. Analysts expect the disinflationary path to continue, and this scenario might bring more weakness for the US Dollar (USD).
At the time of writing, Crude Oil (WTI) trades at $77.02 and Brent Crude at $80.38.
Oil news and market movers: Short term vs longer term
- Three Amframax tankers have been diverted away from the Rotterdam port after having waited nearly two weeks. The tankers reportedly have not made port, according to Bloomberg data.
- The overnight US crude stock change number reported by the American Petroleum Institute (API) came in at a chunky 5.2 million barrels drawdown. This more than doubles the 2 million drawdown expected by analysts.
- The Energy Information Administration (EIA) will publish its stock change data at 14:30 GMT. Analysts expect to see a much smaller draw of 2 million barrels compared to the prior’s weeks drawdown of 3.728 million barrels.
- Bloomberg reported that the US has allowed the sale of missiles to Saudi Arabia, another step of escalation in the Middle Eastern region.
- Meanwhile, retaliation from Iran against Israel is not taking place , creating a moment of easing tensions in the Gaza region as the main parties try to restart ceasefire talks.
Oil Technical Analysis: Here it gets difficult
Oil price has been shooting for the stars since Monday. The fact that both OPEC and the IEA are seeing substantial supply surplus has traders doubling down on changes from OPEC output, away from its commitment to reduce production limitations. The risk to that could be the big US drawdown numbers, leading to very brief rallies. Still, the broader trend seems to be to the downside.
On the upside, the trifecta of moving averages are the main levels to watch. First up is the 200-day Simple Moving Averages (SMA) at $77.68. From there, the 55-day SMA comes into focus at $78.50. The last one comes in at $79.78, just ahead of $80.00, with the 100-day SMA, all residing in a very tight range.
On the downside, a bigger movement could play out. First support comes in at $75.27, but that has been chopped up in July and August so it might have become less relevant. The low from August at $71.17 is the best level for a bounce.
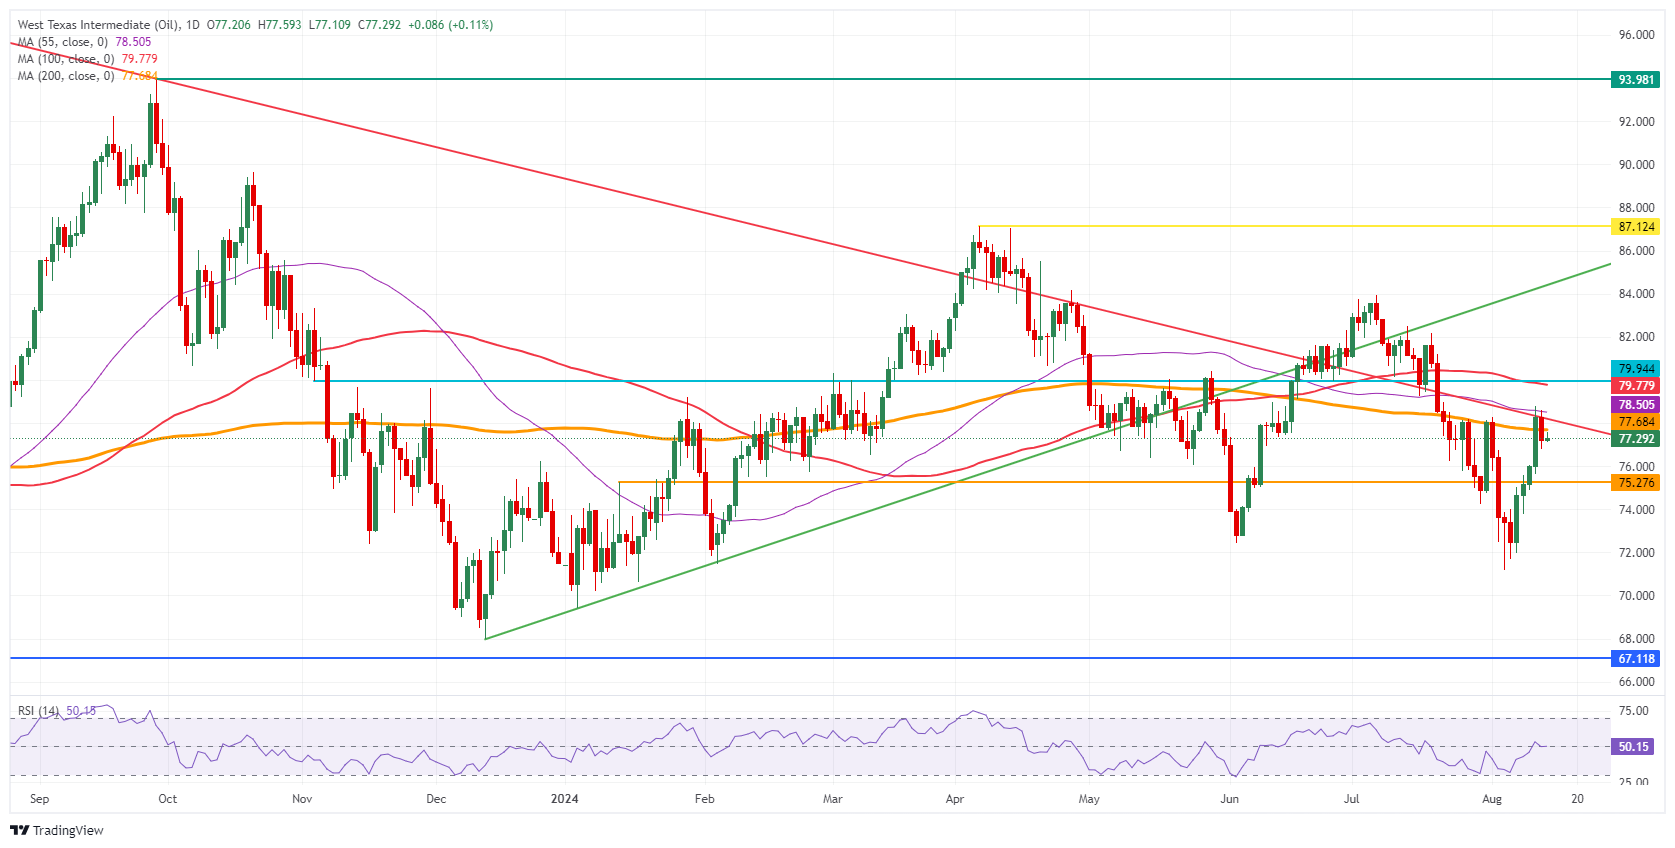
US WTI Crude Oil: Daily Chart
WTI Oil FAQs
WTI Oil is a type of Crude Oil sold on international markets. The WTI stands for West Texas Intermediate, one of three major types including Brent and Dubai Crude. WTI is also referred to as “light” and “sweet” because of its relatively low gravity and sulfur content respectively. It is considered a high quality Oil that is easily refined. It is sourced in the United States and distributed via the Cushing hub, which is considered “The Pipeline Crossroads of the World”. It is a benchmark for the Oil market and WTI price is frequently quoted in the media.
Like all assets, supply and demand are the key drivers of WTI Oil price. As such, global growth can be a driver of increased demand and vice versa for weak global growth. Political instability, wars, and sanctions can disrupt supply and impact prices. The decisions of OPEC, a group of major Oil-producing countries, is another key driver of price. The value of the US Dollar influences the price of WTI Crude Oil, since Oil is predominantly traded in US Dollars, thus a weaker US Dollar can make Oil more affordable and vice versa.
The weekly Oil inventory reports published by the American Petroleum Institute (API) and the Energy Information Agency (EIA) impact the price of WTI Oil. Changes in inventories reflect fluctuating supply and demand. If the data shows a drop in inventories it can indicate increased demand, pushing up Oil price. Higher inventories can reflect increased supply, pushing down prices. API’s report is published every Tuesday and EIA’s the day after. Their results are usually similar, falling within 1% of each other 75% of the time. The EIA data is considered more reliable, since it is a government agency.
OPEC (Organization of the Petroleum Exporting Countries) is a group of 13 Oil-producing nations who collectively decide production quotas for member countries at twice-yearly meetings. Their decisions often impact WTI Oil prices. When OPEC decides to lower quotas, it can tighten supply, pushing up Oil prices. When OPEC increases production, it has the opposite effect. OPEC+ refers to an expanded group that includes ten extra non-OPEC members, the most notable of which is Russia.
Author

Filip Lagaart
FXStreet
Filip Lagaart is a former sales/trader with over 15 years of financial markets expertise under its belt.


