Oil pulls back as US Dollar enjoys renaissance, Crude stocks rise
- Oil price trades with losses as the US Dollar strengthens on hawkish Federal Reserve speeches, US debt-ceiling uncertainty.
- Data showing a greater-than-expected rise in inventories weighs but is balanced by competing data showing rising global demand.
- Oil price is technically in a downtrend – but signs are building for a potential recovery.

Oil price suffers losses on Thursday, trading over a percentage point down at the time of writing, after the US Dollar – which Oil is primarily priced and traded in – makes gains and data from the Energy Information Administration (EIA) showed a larger-than-expected rise in inventories.
WTI Crude Oil is trading around $72.00 and Brent Crude Oil near $75.80 at the time of writing. The commodity has found some support after data from the Joint Organizations Data Initiative (JODI) showed a surge in global demand for Oil in March, on Thursday.
Oil news and market movers
- EIA Crude Oil Stocks Change (May 12) data released late Wednesday shows a 5.04M barrel rise versus estimates of a 0.92M barrel fall, indicating robust supply and putting downward pressure on Oil price.
- The US Dollar gains putting downside pressure on Oil after hawkish comments on Tuesday from Loretta Mester, Federal Reserve’s President for Cleveland. Mester upset expectations that the Fed would not need to raise rates any further after she said that given how stubborn inflation was she couldn’t say for sure that the Fed Funds Rate was at a level “where it’s equally probable that the next move could be an increase or a decrease.”
- Uncertainty over US debt-ceiling talks is a win-win for the US Dollar because of its safe-haven status. Growing fears are thus supportive – as is optimism for a resolution, which would provide more proxy stimulus for the economy, raising US Treasury yields in the process, making further rate hikes more likely and thus supporting USD.
- Data from the Joint Organizations Data Initiative (JODI) showed a surge in global demand for Oil in March, on Thursday, putting a floor under Oil price losses.
- The JODI report showed a surge in global demand of 3M barrels per day (bpd) in March.
- Demand was especially strong in China, according to the report by the Riyadh-based agency, where total product demand jumped by 1.6M barrels per day (bpd) month-on-month to 16.79M bpd in March. It was the third-highest ever increase in demand from the country.
- The US also showed an increase in total product demand of 1.77M bpd month-on-month, to a total of 21.77M bpd, whilst at the same time Oil production in the US declined by a quarter of a million bpd.
Crude Oil Technical Analysis: Downtrend showing signs of ending
WTI Oil is in a long-term downtrend, making lower lows. Given the old adage that the trend is your friend this favors short positions over long positions. It is trading below all the major daily Simple Moving Averages (SMA) and all the weekly SMAs except the 200-week at $66.89.
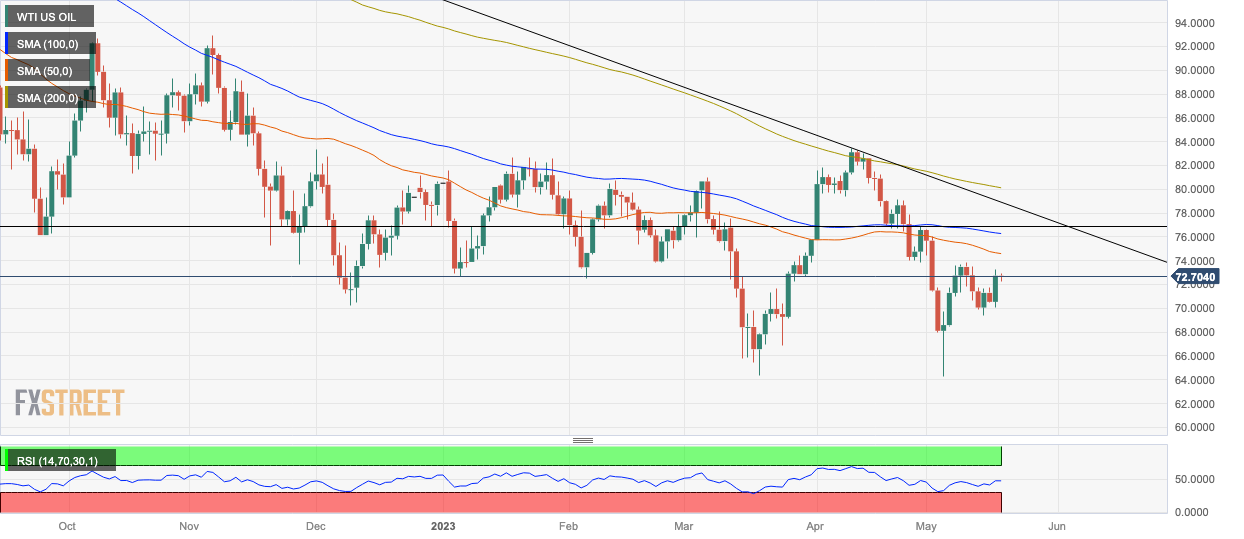
WTI US Oil: Daily Chart
A break below the year-to-date (YTD) lows of $64.31 would be required to reignite and reconfirm the downtrending, however, with the next target at around $62.00 where trough lows from 2021 will come into play as archaic supports.
Despite the dominant downtrend, there are signs that it might be reaching a conclusion. There is mild bullish convergence between price and the Relative Strength Index (RSI) at the March and May 2023 lows, with price making a lower low in May that is not matched by a lower low in RSI. This is a sign bearish pressure is easing.
The long hammer Japanese candlestick pattern that formed at the May 4 (and year-to-date) lows is a further sign this may have been a key strategic bottom.
Oil price bulls, however, would need to break above the $76.85 lower high of April 28 to bring the dominant bear trend into doubt.
Brent Crude Oil FAQs
What is Brent Crude Oil?
Brent Crude Oil is a type of Crude Oil found in the North Sea that is used as a benchmark for international Oil prices. It is considered ‘light’ and ‘sweet’ because of its high gravity and low sulfur content, making it easier to refine into gasoline and other high-value products. Brent Crude Oil serves as a reference price for approximately two-thirds of the world's internationally traded Oil supplies. Its popularity rests on its availability and stability: the North Sea region has well-established infrastructure for Oil production and transportation, ensuring a reliable and consistent supply.
What factors drive the price of Brent Crude Oil
Like all assets supply and demand are the key drivers of Brent Crude Oil price. As such, global growth can be a driver of increased demand and vice versa for weak global growth. Political instability, wars, and sanctions can disrupt supply and impact prices. The decisions of OPEC, a group of major Oil-producing countries, is another key driver of price. The value of the US Dollar influences the price of Brent Crude Oil, since Oil is predominantly traded in US Dollars, thus a weaker US Dollar can make Oil more affordable and vice versa.
How does inventory data impact the price of Brent Crude Oil
The weekly Oil inventory reports published by the American Petroleum Institute (API) and the Energy Information Agency (EIA) impact the price of Brent Crude Oil. Changes in inventories reflect fluctuating supply and demand. If the data shows a drop in inventories it can indicate increased demand, pushing up Oil price. Higher inventories can reflect increased supply, pushing down prices. API’s report is published every Tuesday and EIA’s the day after. Their results are usually similar, falling within 1% of each other 75% of the time. The EIA data is considered more reliable, since it is a government agency.
How does OPEC influence the price of Brent Crude Oil
OPEC (Organization of the Petroleum Exporting Countries) is a group of 13 Oil producing nations who collectively decide production quotas for member countries at twice-yearly meetings. Their decisions often impact Brent Crude Oil prices. When OPEC decides to lower quotas, it can tighten supply, pushing up Oil prices. When OPEC increases production, it has the opposite effect. OPEC+ refers to an expanded group that includes ten extra non-OPEC members, the most notable of which is Russia.
Author

Joaquin Monfort
FXStreet
Joaquin Monfort is a financial writer and analyst with over 10 years experience writing about financial markets and alt data. He holds a degree in Anthropology from London University and a Diploma in Technical analysis.


