Occidental Petroleum Stock News and Forecast: Will Warren Buffet keep buying OXY?
- Occidental Petroleum stock spikes on oil price moves.
- OXY stock closes at a 4-year high as stock breaks May highs.
- OXY is one of Warren Buffet's recent additions to his Berkshire portfolio.

Occidental Petroleum (OXY) stock moved higher on Tuesday in line with a bullish move by oil prices. Crude oil has fallen notably in recent weeks as fears of a global recession saw investors pare back estimates for global oil demand. Oil peaked at $129 in March after the Russian invasion of Ukraine, but it began this week at $89 before closing Tuesday at $94.
Occidental Petroleum stock news
Warren Buffet has taken an ever-increasing bet on OXY stock, which itself is mostly a bet on rising oil prices. The chart below demonstrates how this may already be out of whack. OXY stock has kept on rising despite the recent fall in oil prices. This may have to do with Buffet himself continuing to buy OXY stock but also from copycat investors looking to ride the great man's coattails. Last week it was widely reported that Berkshire Hathway has received regulatory approval to buy up to 50% of Occidental. This resulted in a 10% rise for OXY stock last Friday.
Berkshire owns about 20% of Occidental according to our estimates. Speculation has grown that Buffet may look to acquire Occidental outright after getting this approval. He already reportedly gets along well with OXY CEO Vicky Hollub and has reportedly worked previously with her on Occidental buying Anadarko. When commenting on his initial stake, according to CNBC, Buffet said,
What Vicki Hollub was saying made nothing but sense, and I decided that it was a good place to put Berkshire’s money.
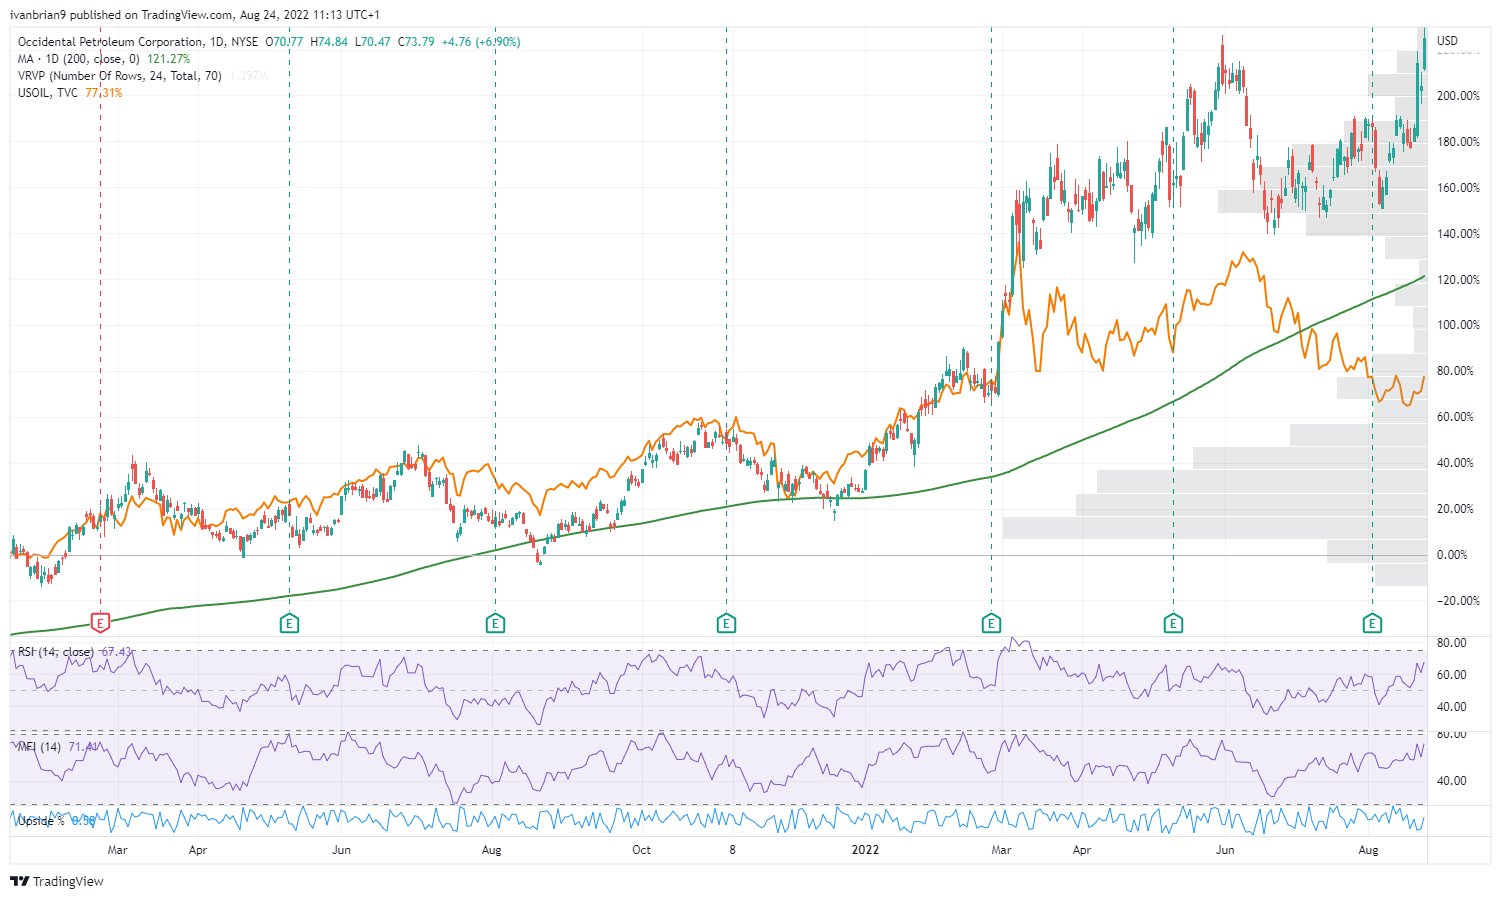
OXY stock versus oil (orange line), daily
Occidental Petroleum stock forecast
Technically, the Buffet frenzy may be artificially inflating OXY stock. The chart below shows its performance versus Chevron (CVX) and Exxon (XOM). OXY stock has massively outperformed them, nearly double the return. This is despite 2022 being a hugely positive year for oil stocks, so OXY looks to have moved too far.
However, when Warren Buffet puts his money down, it means business. OXY has been a top stock among amateur investors and retail traders since the news first broke of the Berkshire Hathaway stake. News of approval to buy up to 50% of Occidental is likely to keep any dip to a minimum before being snapped up. Speculation is mounting that Buffet could look to buy all of Occidental.
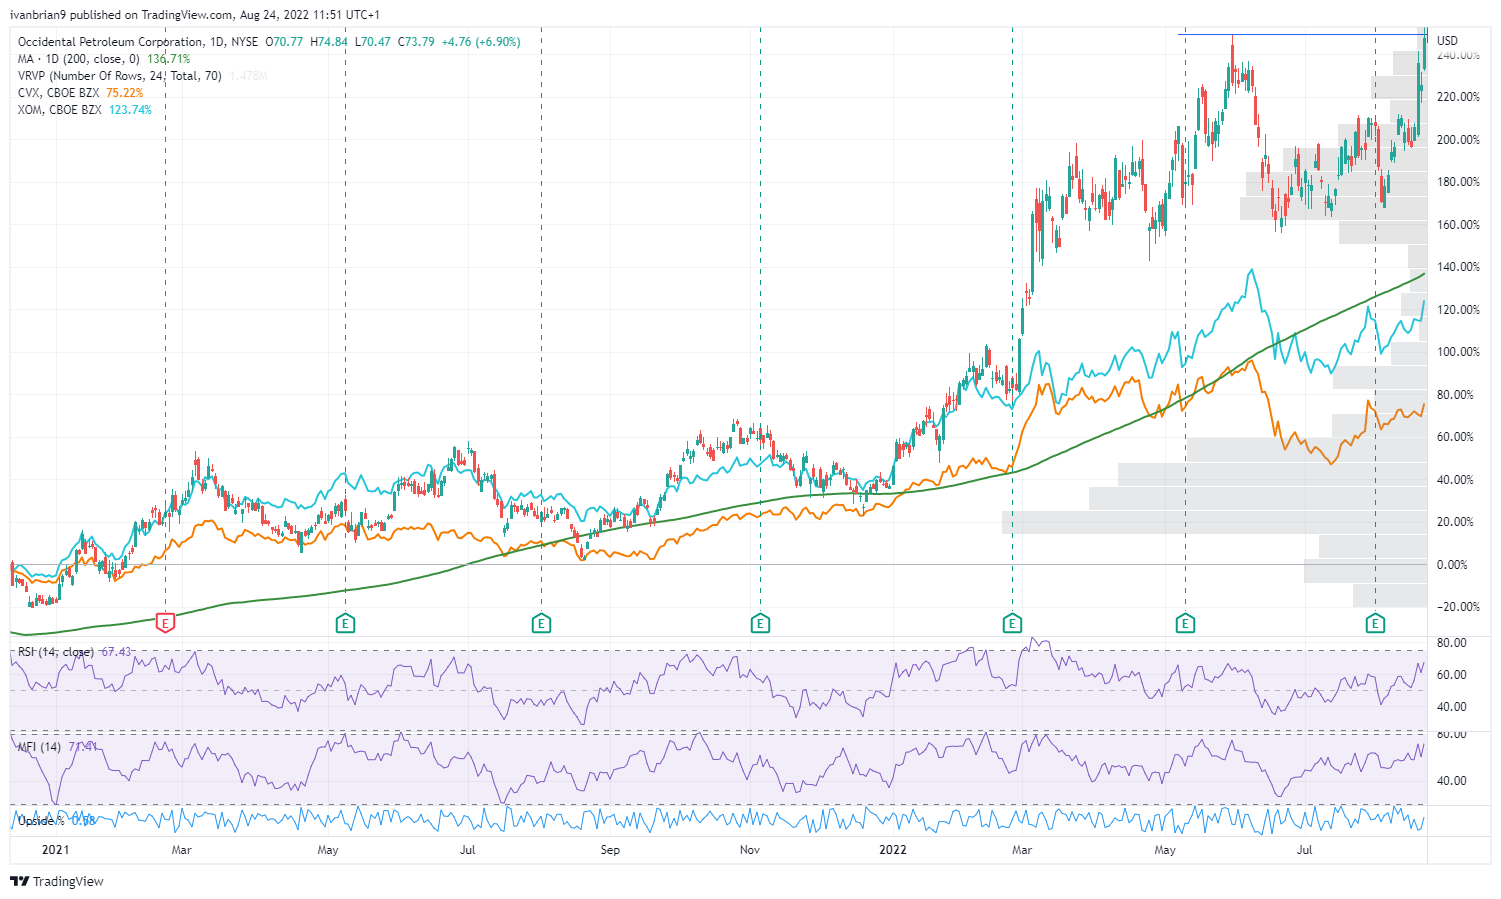
OXY versus Chevron (orange line) and Exxon Mobil (blue line) % gain
Technically speaking, OXY stock has advanced too far relative to the oil price and relative to competitors. Yes, it does have a head start in carbon capture and will benefit more than legacy oil majors from the recent Inflation Reduction Act, but this is future cash flow.
Right now we have an interesting double top in place, but OXY stock will likely spike higher. If not, double tops are strongly bearish formations. OXY is trending strongly and is comfortably above the 200-day moving average. It is clearly overbought relative to oil and the sector in my view, so it may be time to wait and buy the dip.
CNBC has quoted David Kass from the University of Maryland saying Buffet's average purchase price is $60.37.
“I think it is likely that Buffett will buy the whole thing eventually. The 50% limit may have been set to receive FERC approval for a non-controlling stake. He clearly plans to purchase additional shares. So far his maximum purchase price has been $60.37 per share".
It remains to be seen how much higher Buffet will pay and what his ultimate valuation of the OXY stock is. My own view is that it is too high at current levels, but dips back into the low $60s look tempting. This is the high volume area and so a key support level.
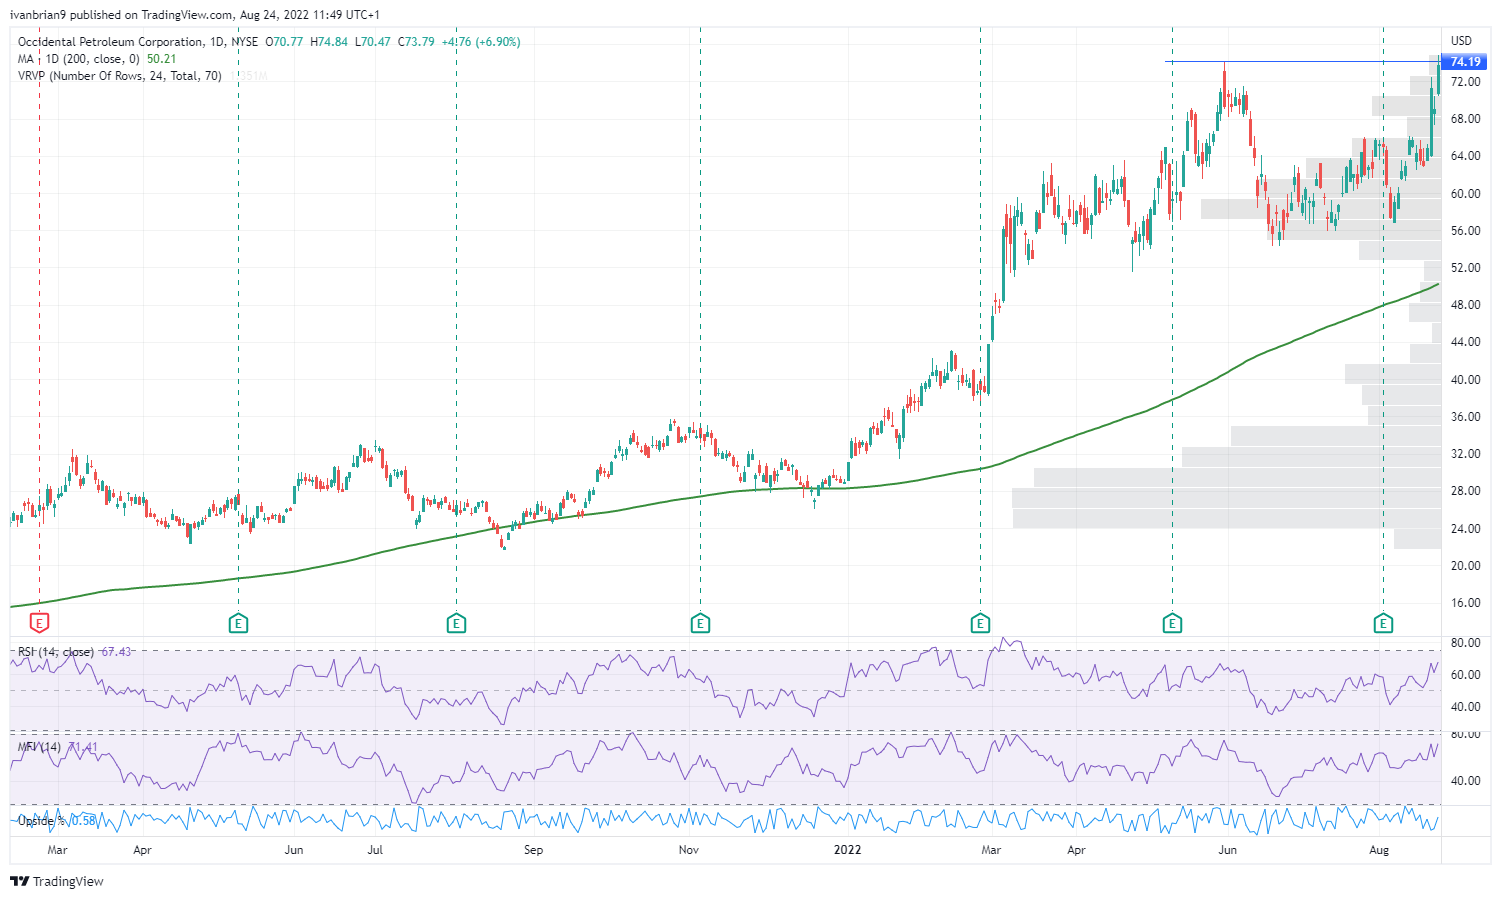
OXY daily chart
Premium
You have reached your limit of 3 free articles for this month.
Start your subscription and get access to all our original articles.
Author

Ivan Brian
FXStreet
Ivan Brian started his career with AIB Bank in corporate finance and then worked for seven years at Baxter. He started as a macro analyst before becoming Head of Research and then CFO.


