- Kiwi flat for Thursday after five straight days of gains.
- NZ indicators tilting into the upside.
- NZ Consumer confidence, US manufacturing data due for Friday.
The NZD/USD is trading flat in Thursday's US trading session, battling back into 0.6150 after seeing a technical rejection from the 0.6200 handle on Wednesday.
The Kiwi (NZD) set an early high of 0.6180 against the US Dollar (USD) before getting sent back down into 0.6120, and the NZD/USD is now stuck at the midway point heading into the back quarter of Thursday's trading window.
Kiwi data tilts into the upside, ANZ Business Confidence hits eight-year peak
Early Thursday saw a notable improvement in New Zealand Building Permits, showing an 8.7% increase in residential building projects in October compared to September's -4.6% (revised upwards slightly from -4.7%).
ANZ's November Business Confidence also saw an improvement from October's 23.4, coming in at an eight-year high of 30.8, the indicator's single-highest reading since March of 2015.
NZ Consumer Confidence, US ISM Manufacturing PMI on the docket for Friday
Up next for Kiwi data will be the ANZ Roy Morgan Consumer Confidence figure for November. New Zealand Consumer Confidence has steadily lagged, dropping below 90.0 back in early 2022, and the indicator could be set an upside beat after last printing at 88.1, its highest reading since dropping to a record low of 73.8 a year ago in December 2022.
Friday's upcoming US trading session will see the ISM Manufacturing Purchasing Managers' Index for November. The manufacturing-focused PMI is expected to improve slightly from October's 46.7 to 47.6.
NZD/USD Technical Outlook
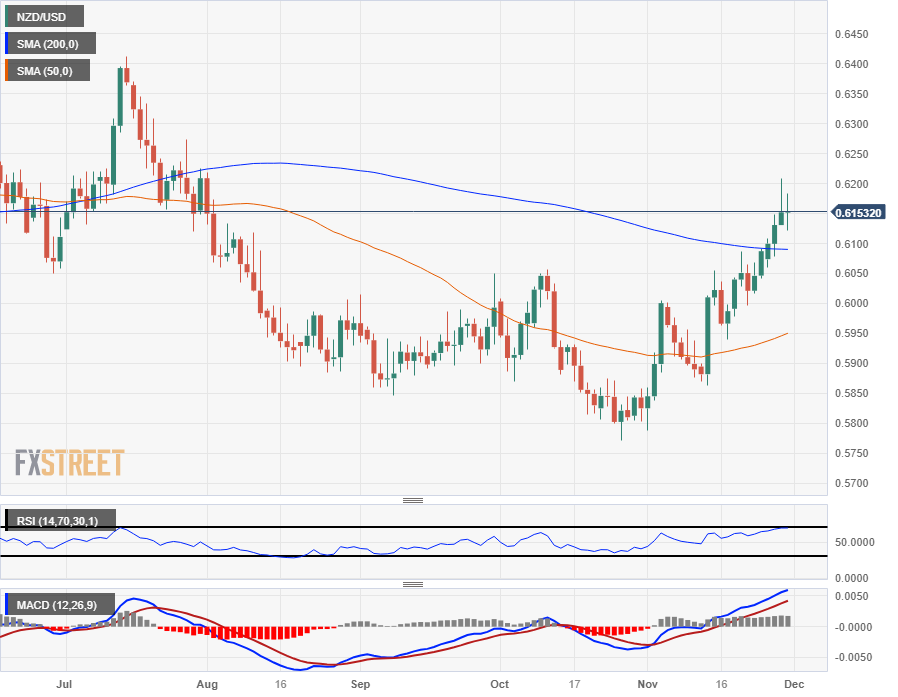
The NZD/USD has closed higher for the past five straight trading days, and gained ground ten of the last twelve days since rallying from 0.5875.
The Kiwi caught a technical rejection from 0.6200 on Wednesday and the pair has thus far succeeded in fighting off a decline back to the 200-day Simple Moving Average (SMA) near 0.6100 as the NZD/USD treads water near 0.6150.
The 50-day SMA, currently rotating bullish from 0.5950, is set to continue rising and will provide technical support into a bullish crossover of the 200-day SMA as long as the NZD/USD continues to bid on the north side of the long-term moving average.
NZD/USD Daily Chart
NZD/USD Technical Levels
Information on these pages contains forward-looking statements that involve risks and uncertainties. Markets and instruments profiled on this page are for informational purposes only and should not in any way come across as a recommendation to buy or sell in these assets. You should do your own thorough research before making any investment decisions. FXStreet does not in any way guarantee that this information is free from mistakes, errors, or material misstatements. It also does not guarantee that this information is of a timely nature. Investing in Open Markets involves a great deal of risk, including the loss of all or a portion of your investment, as well as emotional distress. All risks, losses and costs associated with investing, including total loss of principal, are your responsibility. The views and opinions expressed in this article are those of the authors and do not necessarily reflect the official policy or position of FXStreet nor its advertisers. The author will not be held responsible for information that is found at the end of links posted on this page.
If not otherwise explicitly mentioned in the body of the article, at the time of writing, the author has no position in any stock mentioned in this article and no business relationship with any company mentioned. The author has not received compensation for writing this article, other than from FXStreet.
FXStreet and the author do not provide personalized recommendations. The author makes no representations as to the accuracy, completeness, or suitability of this information. FXStreet and the author will not be liable for any errors, omissions or any losses, injuries or damages arising from this information and its display or use. Errors and omissions excepted.
The author and FXStreet are not registered investment advisors and nothing in this article is intended to be investment advice.


Recommended content
Editors’ Picks

AUD/USD holds above mid-0.6300s amid mixed fundamental cues
AUD/USD consolidates near the weekly low touched on Wednesday amid fading optimism over a quick resolution to the US-China trade dispute. Moreover, easing concerns about the Fed's independence assists the USD to preserve its recovery gains registered over the past two days and acts as a headwind for the currency pair.

EUR/USD strengthens above 1.1300 on gloomy Fed’s Beige Book
The EUR/USD pair edges higher to around 1.1335 during the early Asian session on Thursday. Mitigating concerns over potential tariff threats by US President Donald Trump exerts some selling pressure on the US Dollar.

Gold corrected extreme conditions, struggles around $3,300
Gold extended its decline on Wednesday, slipping below the $3,300 mark per troy ounce in response to reports from the media suggesting the Trump administration is weighing tariff reductions on Chinese goods, a news that revived hopes of easing trade tensions and reduced demand for the yellow metal as a safe-haven asset.

TRUMP meme coin rallies following announcement of President Trump's upcoming dinner with top 220 holders
Official TRUMP rallied 50% on Wednesday after the team behind the meme coin announced plans for its top 220 token holders to have a dinner with President Donald Trump in May. The announcement also included an extension of the token's initial unlock plan by an additional 90 days.

Five fundamentals for the week: Traders confront the trade war, important surveys, key Fed speech Premium
Will the US strike a trade deal with Japan? That would be positive progress. However, recent developments are not that positive, and there's only one certainty: headlines will dominate markets. Fresh US economic data is also of interest.

The Best brokers to trade EUR/USD
SPONSORED Discover the top brokers for trading EUR/USD in 2025. Our list features brokers with competitive spreads, fast execution, and powerful platforms. Whether you're a beginner or an expert, find the right partner to navigate the dynamic Forex market.