NZD/USD pulls back to neckline of topping pattern again
- NZD/USD has pulled back up to the neckline of a topping pattern again.
- The move comes despite the pair making a new low on June 28.
- A close higher could invalidate the pattern and indicate a possible upside reversal.

NZD/USD has recovered back up to the “neckline” of a complex multi-peak topping pattern that has formed since the middle of May. This is the second time NZD/USD has recovered back up to test the neckline, the level underpinning the pattern’s trough lows.
NZD/USD 4-hour Chart
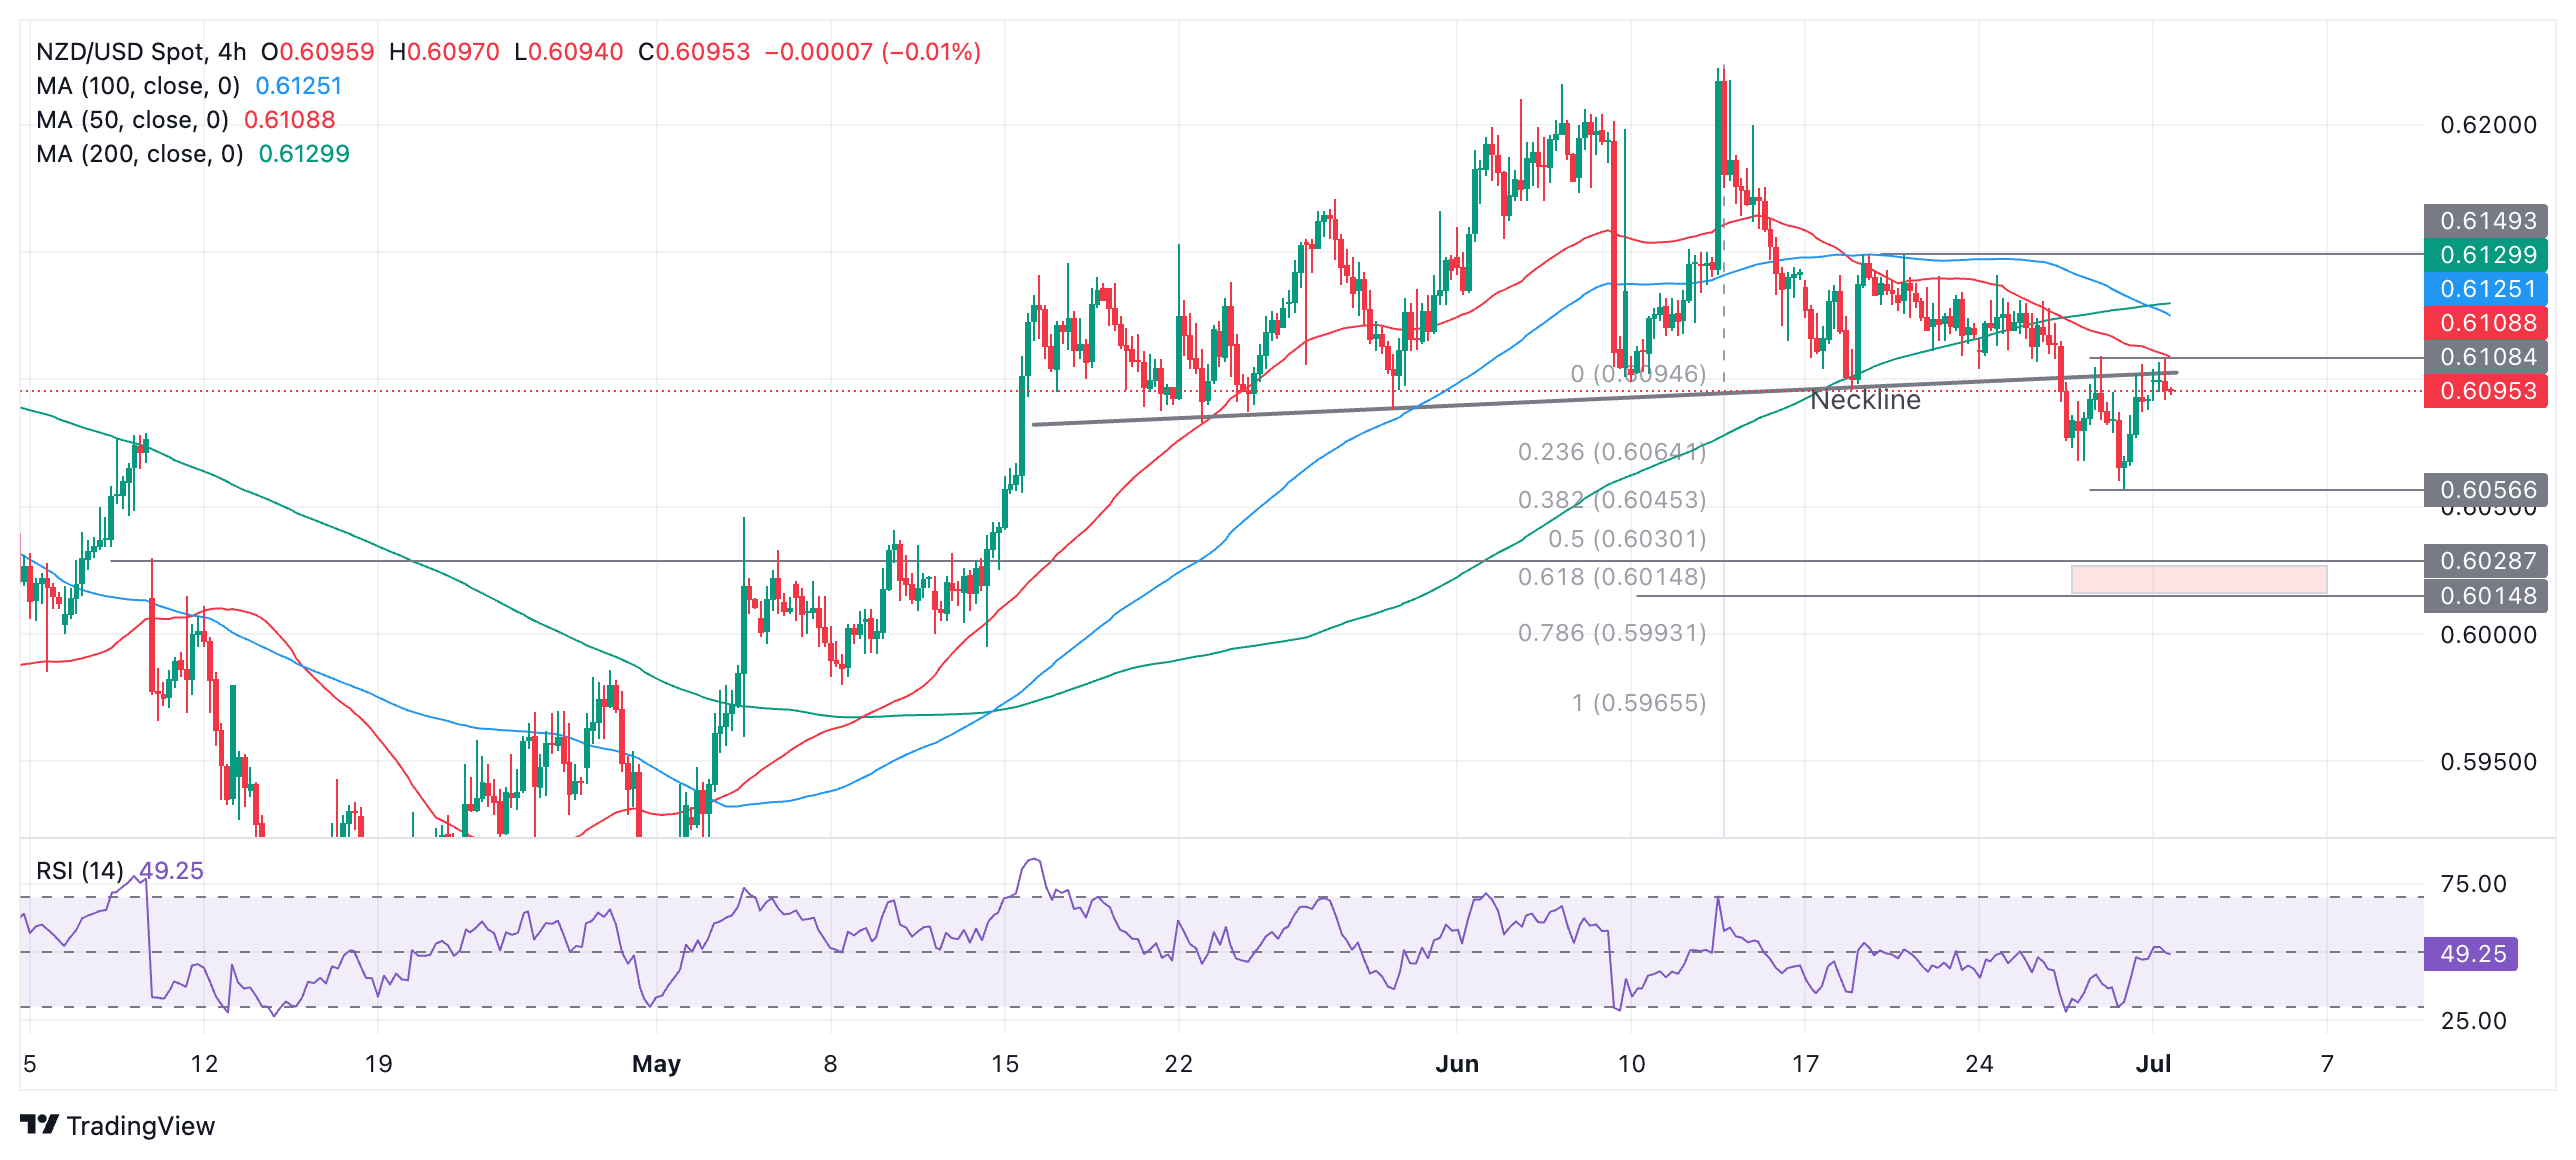
NZD/USD first penetrated the neckline on June 26, falling to a low of 0.6068. However, it quickly mounted a recovery and returned back to the neckline on the following day. The pair then resumed its downside, however, falling to a new low of 0.6057 on June 28. Bears failed to maintain the downside momentum, however, and now the pair has recovered for a second time back up to the level of the neckline.
A recovery back up to the neckline of a topping pattern is called a “throwback” move in technical parlance. The fact that this has happened a second time is unusual and suggests waning downside momentum. It introduces a risk that the initial break lower may have been a false break and NZD/USD could now rally back above the neckline higher.
The pair completed a bearish Shooting Star Japanese candlestick pattern during the last 4-hour period. If this is followed up by another bearish candle it would confirm a reversal pattern, and would suggest a move lower. However, candlestick patterns are very short-term indicators. A break below the June 28 low at 0.6057 would be required to confirm further downside, with the next target in a zone between 0.6028 (bottom of April 10 price gap) and 0.6015, the Fibonacci 0.618 extrapolation of the height of the pattern lower.
A break above the 0.6108 highs on a closing basis would bring into doubt the bearish hypothesis and possibly indicate a recovery. A move above the 0.6149 (June 13 and 14 high) would invalidate the bearish pattern and probably indicate the birth of a new short-term uptrend.
Author

Joaquin Monfort
FXStreet
Joaquin Monfort is a financial writer and analyst with over 10 years experience writing about financial markets and alt data. He holds a degree in Anthropology from London University and a Diploma in Technical analysis.


