NZD/USD Price Forecast: Remains tepid near 0.6050, two-month lows
- NZD/USD could test the immediate support around a two-month low at 0.6039 level.
- The daily-chart analysis suggests the short-term market bias is bearish for the pair.
- A break above the immediate resistance at the nine-day and 50-day EMAs could trigger a shift toward a bullish bias.

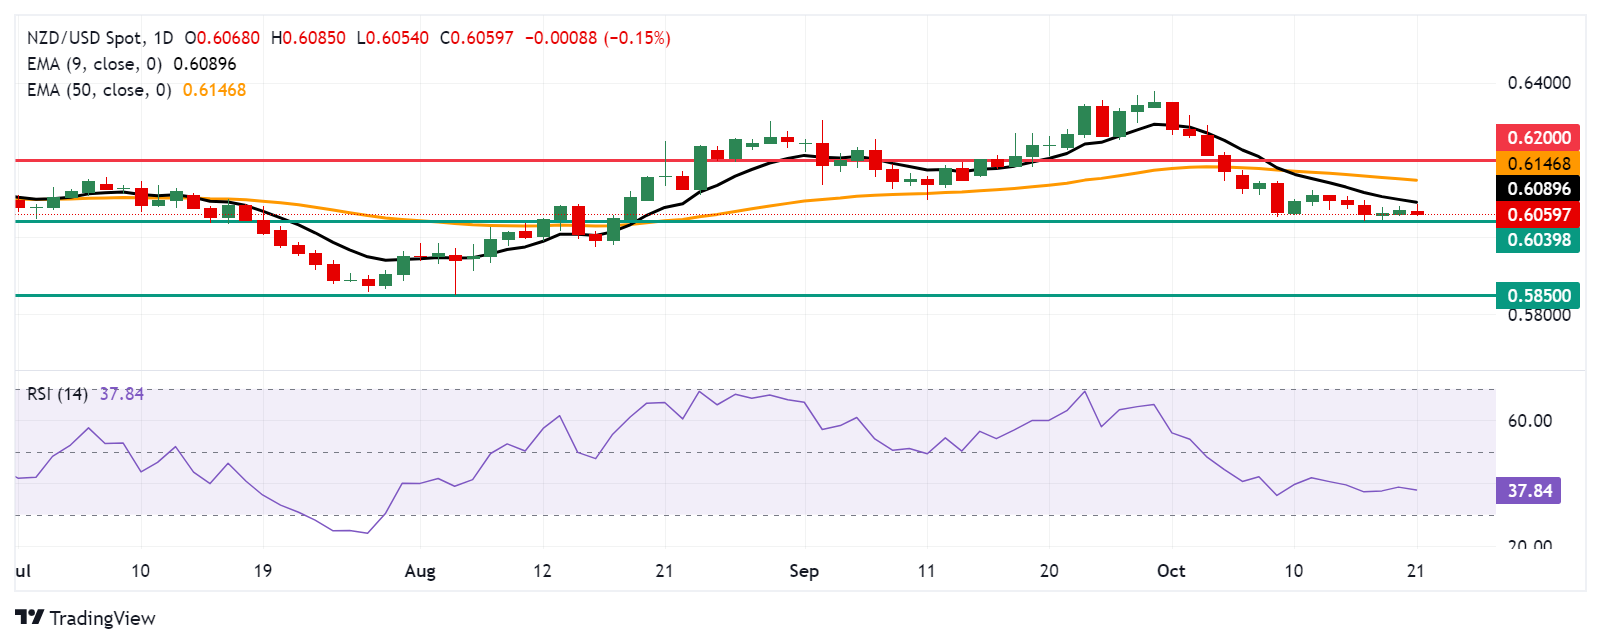
The NZD/USD loses ground after two days of gains, trading around 0.6060 during Monday’s European hours. The analysis of the daily chart shows that the pair remains below the nine-day Exponential Moving Average (EMA), which suggests the short-term market bias is bearish.
Additionally, the 14-day Relative Strength Index (RSI) consolidates below the 30 level, reinforcing the current bearish sentiment. Furthermore, the nine-day Exponential Moving Average (EMA) remains below the 50-day EMA, highlighting weakness in the short-term price trend for the pair.
On the downside, the NZD/USD pair tests immediate support around a two-month low at 0.6039 level, which was recorded on October 16, followed by the psychological level of 0.6000. A break below this level could exert downward pressure on the pair to re-test the area around the "pullback support" near the 0.5850 level.
In terms of resistance, the immediate resistance appears at the nine-day Exponential Moving Average (EMA) around the level of 0.6089, followed by the 50-day EMA at 0.6146 level. A break above the latter could cause the emergence of the short-term bullish bias, potentially allowing the NZD/USD pair to target the psychological level of 0.6200.
NZD/USD: Daily Chart
New Zealand Dollar PRICE Today
The table below shows the percentage change of New Zealand Dollar (NZD) against listed major currencies today. New Zealand Dollar was the weakest against the Canadian Dollar.
| USD | EUR | GBP | JPY | CAD | AUD | NZD | CHF | |
|---|---|---|---|---|---|---|---|---|
| USD | 0.11% | 0.20% | 0.27% | 0.00% | 0.23% | 0.13% | 0.07% | |
| EUR | -0.11% | 0.02% | 0.10% | -0.04% | 0.10% | -0.08% | -0.12% | |
| GBP | -0.20% | -0.02% | 0.06% | -0.19% | 0.04% | -0.07% | -0.18% | |
| JPY | -0.27% | -0.10% | -0.06% | -0.27% | -0.04% | -0.09% | -0.26% | |
| CAD | -0.01% | 0.04% | 0.19% | 0.27% | 0.13% | 0.18% | -0.07% | |
| AUD | -0.23% | -0.10% | -0.04% | 0.04% | -0.13% | -0.03% | -0.24% | |
| NZD | -0.13% | 0.08% | 0.07% | 0.09% | -0.18% | 0.03% | -0.12% | |
| CHF | -0.07% | 0.12% | 0.18% | 0.26% | 0.07% | 0.24% | 0.12% |
The heat map shows percentage changes of major currencies against each other. The base currency is picked from the left column, while the quote currency is picked from the top row. For example, if you pick the New Zealand Dollar from the left column and move along the horizontal line to the US Dollar, the percentage change displayed in the box will represent NZD (base)/USD (quote).
Author

Akhtar Faruqui
FXStreet
Akhtar Faruqui is a Forex Analyst based in New Delhi, India. With a keen eye for market trends and a passion for dissecting complex financial dynamics, he is dedicated to delivering accurate and insightful Forex news and analysis.


