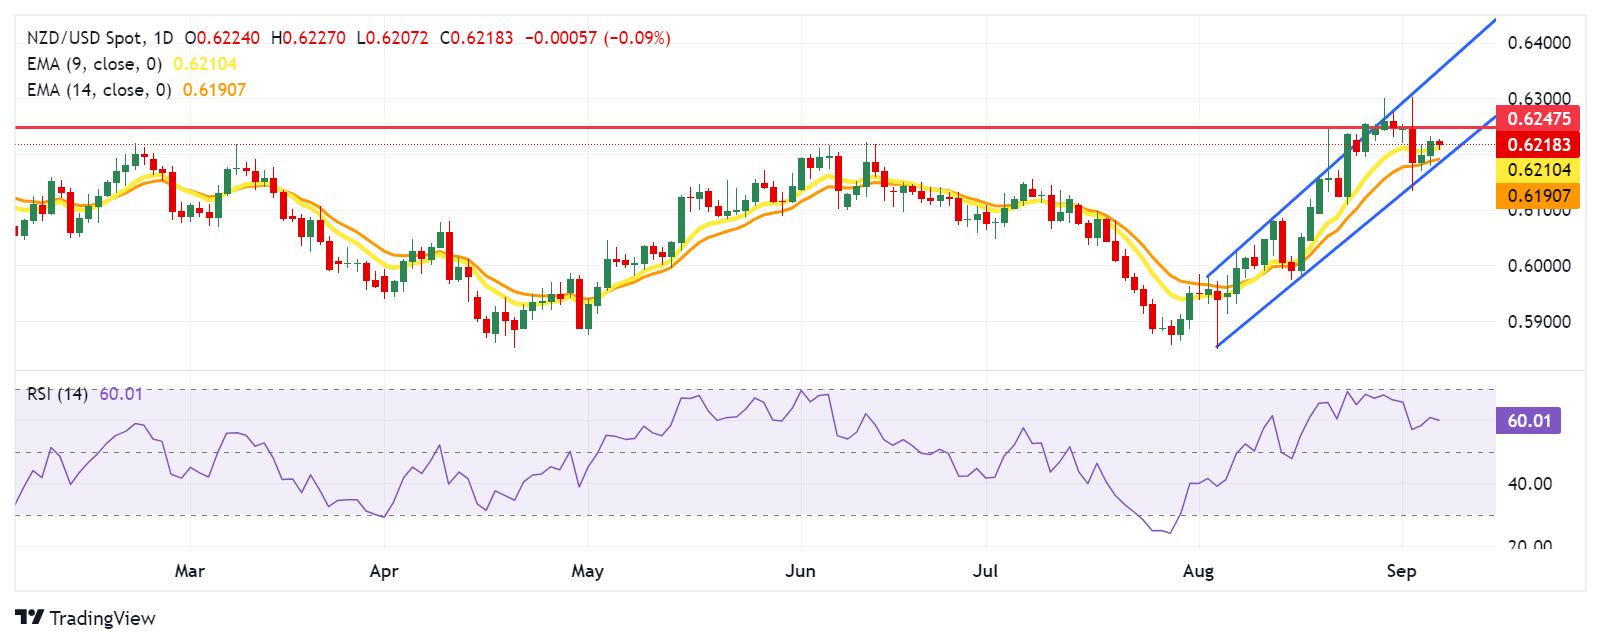
- NZD/USD could test the nine-day EMA at 0.6210, followed by the seven-month high of 0.6247.
- The 14-day RSI remains above the 50 level, confirming a persistent bullish trend.
- The immediate support appears around the psychological level of 0.6200, aligned with the 14-day EMA at 0.6190.
NZD/USD retraces its recent gains, trading around 0.6210 during the Asian hours on Friday. On the daily chart, the pair treks above the lower boundary of the ascending channel, which supports a bullish outlook. A move below the lower boundary could weaken the bullish sentiment.
The 14-day Relative Strength Index (RSI) remains above the 50 level, signaling a persistent bullish trend. Furthermore, the nine-day Exponential Moving Average (EMA) is above the 14-day EMA, indicating that the NZD/USD pair is experiencing short-term upward momentum and is expected to continue its rise.
On the upside, the NZD/USD pair faces immediate resistance near the nine-day EMA at 0.6210, with further resistance at the seven-month high of 0.6247 recorded on August 21. A break above this level could drive the pair toward the upper boundary of the ascending channel, around 0.6350.
For support, the NZD/USD pair may test the 14-day EMA at the 0.6190 level, which aligns with the lower boundary of the ascending channel. A drop below this level could diminish the bullish bias and drive the pair toward the psychological level of 0.6100.
NZD/USD: Daily Chart
New Zealand Dollar PRICE Today
The table below shows the percentage change of New Zealand Dollar (NZD) against listed major currencies today. New Zealand Dollar was the weakest against the Japanese Yen.
| USD | EUR | GBP | JPY | CAD | AUD | NZD | CHF | |
|---|---|---|---|---|---|---|---|---|
| USD | -0.05% | 0.02% | -0.80% | -0.06% | 0.15% | 0.09% | -0.27% | |
| EUR | 0.05% | 0.07% | -0.76% | -0.03% | 0.20% | 0.13% | -0.22% | |
| GBP | -0.02% | -0.07% | -0.81% | -0.08% | 0.14% | 0.07% | -0.29% | |
| JPY | 0.80% | 0.76% | 0.81% | 0.75% | 0.96% | 0.87% | 0.52% | |
| CAD | 0.06% | 0.03% | 0.08% | -0.75% | 0.20% | 0.16% | -0.21% | |
| AUD | -0.15% | -0.20% | -0.14% | -0.96% | -0.20% | -0.07% | -0.44% | |
| NZD | -0.09% | -0.13% | -0.07% | -0.87% | -0.16% | 0.07% | -0.36% | |
| CHF | 0.27% | 0.22% | 0.29% | -0.52% | 0.21% | 0.44% | 0.36% |
The heat map shows percentage changes of major currencies against each other. The base currency is picked from the left column, while the quote currency is picked from the top row. For example, if you pick the New Zealand Dollar from the left column and move along the horizontal line to the US Dollar, the percentage change displayed in the box will represent NZD (base)/USD (quote).
Information on these pages contains forward-looking statements that involve risks and uncertainties. Markets and instruments profiled on this page are for informational purposes only and should not in any way come across as a recommendation to buy or sell in these assets. You should do your own thorough research before making any investment decisions. FXStreet does not in any way guarantee that this information is free from mistakes, errors, or material misstatements. It also does not guarantee that this information is of a timely nature. Investing in Open Markets involves a great deal of risk, including the loss of all or a portion of your investment, as well as emotional distress. All risks, losses and costs associated with investing, including total loss of principal, are your responsibility. The views and opinions expressed in this article are those of the authors and do not necessarily reflect the official policy or position of FXStreet nor its advertisers. The author will not be held responsible for information that is found at the end of links posted on this page.
If not otherwise explicitly mentioned in the body of the article, at the time of writing, the author has no position in any stock mentioned in this article and no business relationship with any company mentioned. The author has not received compensation for writing this article, other than from FXStreet.
FXStreet and the author do not provide personalized recommendations. The author makes no representations as to the accuracy, completeness, or suitability of this information. FXStreet and the author will not be liable for any errors, omissions or any losses, injuries or damages arising from this information and its display or use. Errors and omissions excepted.
The author and FXStreet are not registered investment advisors and nothing in this article is intended to be investment advice.
Recommended content
Editors’ Picks

EUR/USD extends recovery beyond 1.0400 amid Wall Street's turnaround
EUR/USD extends its recovery beyond 1.0400, helped by the better performance of Wall Street and softer-than-anticipated United States PCE inflation. Profit-taking ahead of the winter holidays also takes its toll.

GBP/USD nears 1.2600 on renewed USD weakness
GBP/USD extends its rebound from multi-month lows and approaches 1.2600. The US Dollar stays on the back foot after softer-than-expected PCE inflation data, helping the pair edge higher. Nevertheless, GBP/USD remains on track to end the week in negative territory.

Gold rises above $2,620 as US yields edge lower
Gold extends its daily rebound and trades above $2,620 on Friday. The benchmark 10-year US Treasury bond yield declines toward 4.5% following the PCE inflation data for November, helping XAU/USD stretch higher in the American session.

Bitcoin crashes to $96,000, altcoins bleed: Top trades for sidelined buyers
Bitcoin (BTC) slipped under the $100,000 milestone and touched the $96,000 level briefly on Friday, a sharp decline that has also hit hard prices of other altcoins and particularly meme coins.

Bank of England stays on hold, but a dovish front is building
Bank of England rates were maintained at 4.75% today, in line with expectations. However, the 6-3 vote split sent a moderately dovish signal to markets, prompting some dovish repricing and a weaker pound. We remain more dovish than market pricing for 2025.

Best Forex Brokers with Low Spreads
VERIFIED Low spreads are crucial for reducing trading costs. Explore top Forex brokers offering competitive spreads and high leverage. Compare options for EUR/USD, GBP/USD, USD/JPY, and Gold.