|

NZD/USD Price Analysis: Time for a bumpy ride ahead below 0.6100 ahead of US GDP

  • NZD/USD has shown a less-confident recovery after a fresh six-week low of 0.6112, however, the downside seems favored.
  • Soaring risk of investment in the S&P500 improved the appeal for the US Dollar Index as safe-haven.
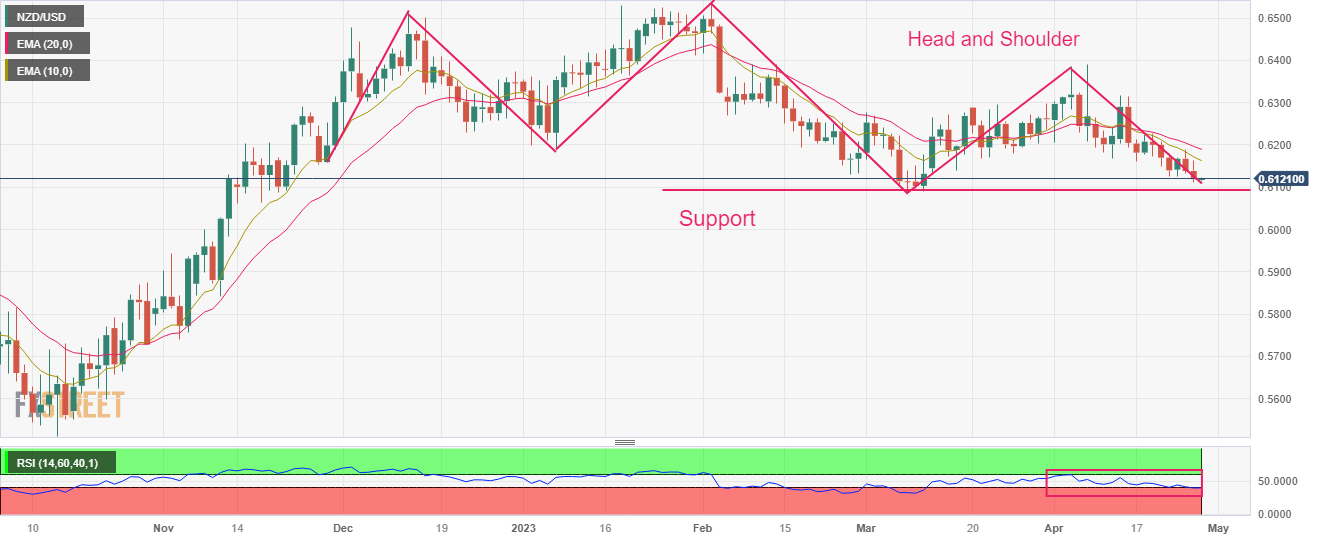
  • NZD/USD is making a Head and Shoulder chart pattern and a breakdown of the same results in a bearish reversal.

The NZD/USD pair has shown a mild recovery after printing a fresh six-week low of 0.6112 in the early Tokyo session. The Kiwi asset witnessed a steep fall on Wednesday after a V-shape recovery from the US Dollar Index (DXY) and a sell-off in the New Zealand Dollar over a headline that the Reserve Bank of New Zealand (RBNZ) has considered the qualitative easing proposal citing that current restrictions may be unnecessarily reducing efficiency as risks to financial stability are lower.

The USD Index recovered sharply after dropping to near 101.00 as the soaring risk of investment in the S&P500 improved the appeal for the former as a safe-haven.

Going forward, the United States annualized Gross Domestic Product (GDP) (Q1) data will remain in the spotlight. The street is anticipating a decline in the growth rate to 2.0% from the former pace of 2.6%.

NZD/USD is making a Head and Shoulder chart pattern on a daily scale, which signals a long consolidation, and a breakdown of the same results in a bearish reversal. Broadly, the New Zealand Dollar will remain safe if it manages to sustain above the horizontal resistance plotted from March 08 low at 0.6084.

Declining 10-and 20-period Exponential Moving Averages (EMAs) at 0.6162 and 0.6190 respectively indicate more weakness ahead.

Meanwhile, the Relative Strength Index (RSI) (14) is on the edge of the bearish range of 20.00-40.00. A slippage inside the same will activate the downside momentum.

Going ahead, a breakdown of April 26 low at 0.6110 will drag the asset toward March 08 low at 0.6088 followed by the 15 Nov 2022 low at 0.6058.

Alternatively, an upside move above April 24 high at 0.6168 will drive the Kiwi asset toward the round-level resistance at 0.6200. A breach of the latter will allow the Kiwi to report a fresh weekly high above April 19 high at 0.6227.

NZD/USD daily chart

NZD/USD

Overview
Today last price0.612
Today Daily Change-0.0018
Today Daily Change %-0.29
Today daily open0.6138
 
Trends
Daily SMA200.6227
Daily SMA500.6215
Daily SMA1000.6295
Daily SMA2000.6162
 
Levels
Previous Daily High0.6189
Previous Daily Low0.6132
Previous Weekly High0.6227
Previous Weekly Low0.6126
Previous Monthly High0.6298
Previous Monthly Low0.6084
Daily Fibonacci 38.2%0.6154
Daily Fibonacci 61.8%0.6167
Daily Pivot Point S10.6117
Daily Pivot Point S20.6096
Daily Pivot Point S30.606
Daily Pivot Point R10.6174
Daily Pivot Point R20.621
Daily Pivot Point R30.6231

Author

Sagar Dua

Sagar Dua

FXStreet

Sagar Dua is associated with the financial markets from his college days. Along with pursuing post-graduation in Commerce in 2014, he started his markets training with chart analysis.

More from Sagar Dua
Share:

Markets move fast. We move first.

Orange Juice Newsletter brings you expert driven insights - not headlines. Every day on your inbox.

By subscribing you agree to our Terms and conditions.

Editor's Picks

EUR/USD clings to small gains near 1.1750

Following a short-lasting correction in the early European session, EUR/USD regains its traction and clings to moderate gains at around 1.1750 on Monday. Nevertheless, the pair's volatility remains low, with investors awaiting this weeks key data releases from the US and the ECB policy announcements.

GBP/USD edges higher toward 1.3400 ahead of US data and BoE

GBP/USD reverses its direction and advances toward 1.3400 following a drop to the 1.3350 area earlier in the day. The US Dollar struggles to gather recovery momentum as markets await Tuesday's Nonfarm Payrolls data, while the Pound Sterling holds steady ahead of the BoE policy announcements later in the week.

Gold pulls away from session high, holds above $4,300

Gold loses its bullish momentum and retreats below $4,350 after testing this level earlier on Monday. XAU/USD, however, stays in positive territory as the US Dollar remains on the back foot on growing expectations for a dovish Fed policy outlook next year.

Solana consolidates as spot ETF inflows near $1 billion signal institutional dip-buying

Solana price hovers above $131 at the time of writing on Monday, nearing the upper boundary of a falling wedge pattern, awaiting a decisive breakout. On the institutional side, demand for spot Solana Exchange-Traded Funds remained firm, pushing total assets under management to nearly $1 billion since launch. 

Big week ends with big doubts

The S&P 500 continued to push higher yesterday as the US 2-year yield wavered around the 3.50% mark following a Federal Reserve (Fed) rate cut earlier this week that was ultimately perceived as not that hawkish after all. The cut is especially boosting the non-tech pockets of the market.

Solana Price Forecast: SOL consolidates as spot ETF inflows near $1 billion signal institutional dip-buying

Solana (SOL) price hovers above $131 at the time of writing on Monday, nearing the upper boundary of a falling wedge pattern, awaiting a decisive breakout.