- NZD/USD seesaws around intraday high, remains indecisive on a day.
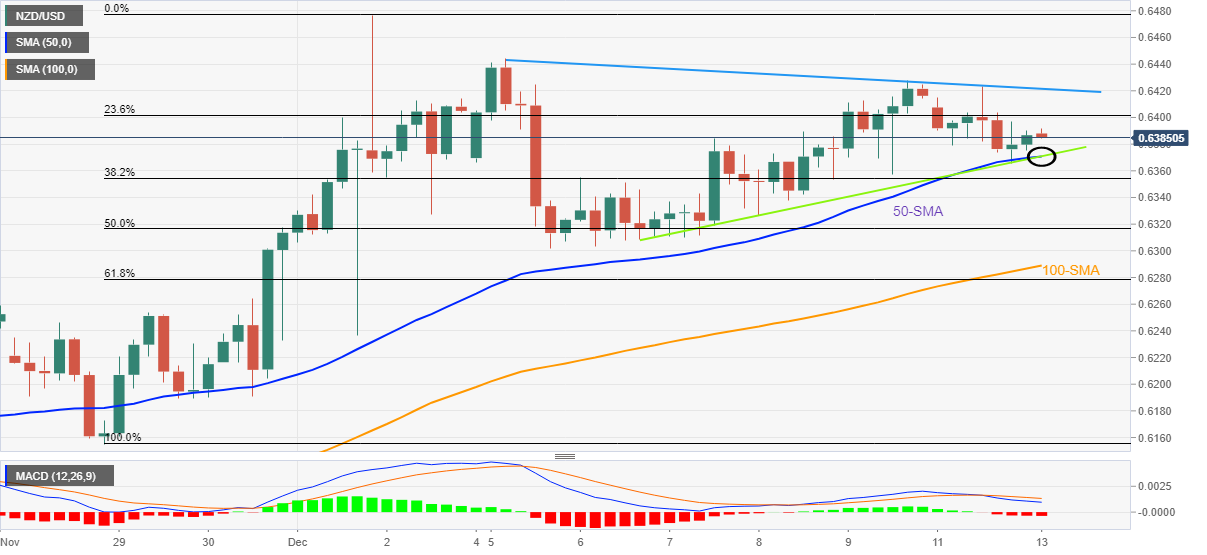
- Convergence of 50-SMA, one-week-old ascending trend appears a tough nut crack for bears.
- Bulls need validation from 0.6420 to retake control.
NZD/USD takes rounds to 0.6390 during early Tuesday as the Kiwi pair traders await more clues to extend the latest recovery from the key support confluence. In doing so, the quote highlights the market’s cautious mood ahead of the United States inflation numbers for November, namely the Consumer Price Index (CPI).
Although NZD/USD snapped a three-day uptrend the previous day, the bears couldn’t conquer a convergence of the 50-bar Simple Moving Average (SMA) and a one-week-old ascending support line, around 0.6370.
The pair’s rebound, however, battles with the bearish MACD signals to challenge the NZD/USD buyers. Also challenging the Kiwi pair’s upside momentum could be the downward-sloping resistance line from December 05, close to 0.6420 by the press time.
In a case where the NZD/USD remains firmer past 0.6420, the odds of witnessing a run-up to refresh the monthly high surrounding 0.6475-80 can’t be ruled out.
On the flip side, a clear break of the 0.6370 support confluence could quickly fetch the quote towards the previous weekly low near the 0.6300 round figure.
However, the 100-SMA and 61.8% Fibonacci retracement level of the NZD/USD pair’s November 28 to December 01 upside, respectively near 0.6290 and 0.6280, could challenge the bears afterward.
NZD/USD: Four-hour chart
Trend: Limited upside expected
Information on these pages contains forward-looking statements that involve risks and uncertainties. Markets and instruments profiled on this page are for informational purposes only and should not in any way come across as a recommendation to buy or sell in these assets. You should do your own thorough research before making any investment decisions. FXStreet does not in any way guarantee that this information is free from mistakes, errors, or material misstatements. It also does not guarantee that this information is of a timely nature. Investing in Open Markets involves a great deal of risk, including the loss of all or a portion of your investment, as well as emotional distress. All risks, losses and costs associated with investing, including total loss of principal, are your responsibility. The views and opinions expressed in this article are those of the authors and do not necessarily reflect the official policy or position of FXStreet nor its advertisers. The author will not be held responsible for information that is found at the end of links posted on this page.
If not otherwise explicitly mentioned in the body of the article, at the time of writing, the author has no position in any stock mentioned in this article and no business relationship with any company mentioned. The author has not received compensation for writing this article, other than from FXStreet.
FXStreet and the author do not provide personalized recommendations. The author makes no representations as to the accuracy, completeness, or suitability of this information. FXStreet and the author will not be liable for any errors, omissions or any losses, injuries or damages arising from this information and its display or use. Errors and omissions excepted.
The author and FXStreet are not registered investment advisors and nothing in this article is intended to be investment advice.
Recommended content
Editors’ Picks

AUD/USD appreciates as US Dollar remains subdued after a softer inflation report
The Australian Dollar steadies following two days of gains on Monday as the US Dollar remains subdued following the Personal Consumption Expenditures Price Index data from the United States released on Friday.

USD/JPY consolidates around 156.50 area; bullish bias remains
USD/JPY holds steady around the mid-156.00s at the start of a new week and for now, seems to have stalled a modest pullback from the 158.00 neighborhood, or over a five-month top touched on Friday. Doubts over when the BoJ could hike rates again and a positive risk tone undermine the safe-haven JPY.

Gold downside bias remains intact while below $2,645
Gold price is looking to extend its recovery from monthly lows into a third day on Monday as buyers hold their grip above the $2,600 mark. However, the further upside appears elusive amid a broad US Dollar bounce and a pause in the decline of US Treasury bond yields.

Week ahead: No festive cheer for the markets after hawkish Fed
US and Japanese data in focus as markets wind down for Christmas. Gold and stocks bruised by Fed, but can the US dollar extend its gains? Risk of volatility amid thin trading and Treasury auctions.

Bank of England stays on hold, but a dovish front is building
Bank of England rates were maintained at 4.75% today, in line with expectations. However, the 6-3 vote split sent a moderately dovish signal to markets, prompting some dovish repricing and a weaker pound. We remain more dovish than market pricing for 2025.

Best Forex Brokers with Low Spreads
VERIFIED Low spreads are crucial for reducing trading costs. Explore top Forex brokers offering competitive spreads and high leverage. Compare options for EUR/USD, GBP/USD, USD/JPY, and Gold.