|

NZD/USD Price Analysis: Stays inside prior day’s range ahead of RBNZ policy

  • NZD/USD is oscillating inside the previous day’s range as the focus shifts to RBNZ policy.
  • The USD Index is struggling to find strength despite rising wage pressures.
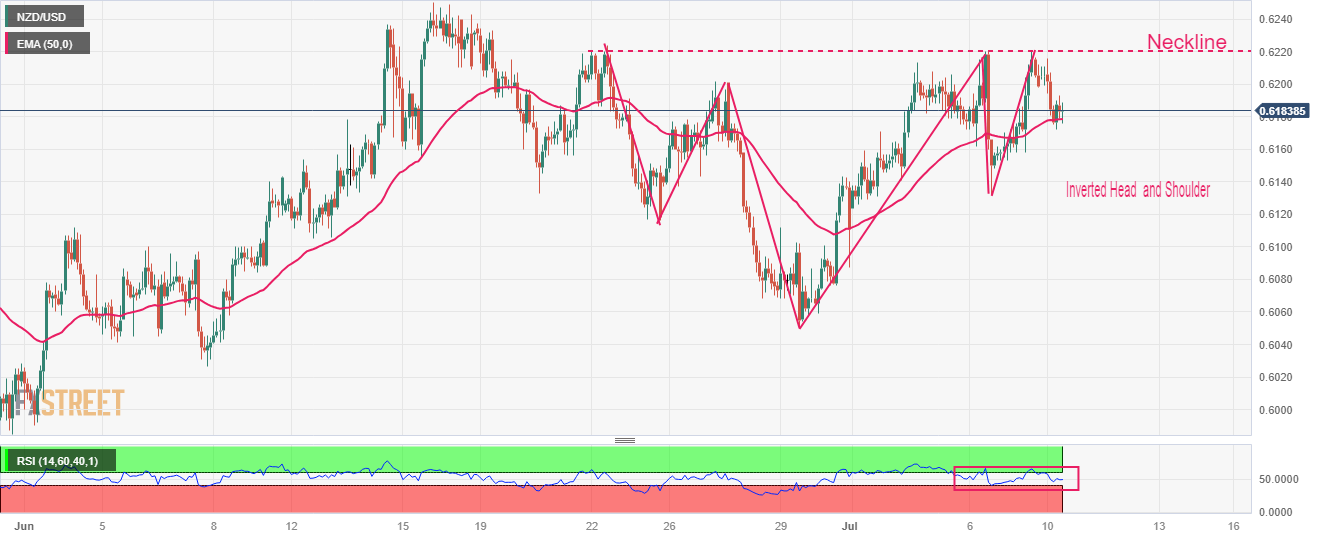
  • NZD/USD is forming an Inverted Head and Shoulder chart pattern, which indicates a wide consolidation.

The NZD/USD pair is displaying topsy-turvy moves below the round-level resistance of 0.6200 in the European session. The Kiwi asset has turned choppy as investors are awaiting the interest rate decision by the Reserve Bank of New Zealand (RBNZ), which is scheduled for Wednesday at 2:00 GMT.

S&P500 futures have recovered its entire losses posted in Asia, portraying recovery in the risk appetite of the market participants. The US Dollar Index (DXY) has rebounded briskly to near 102.45. The USD Index is struggling to find strength despite rising wage pressures and sustainability in labor market conditions.

Meanwhile, RBNZ Governor Adrian Orr will likely keep interest rates unchanged at 5.50%, marking an end to its 20-month-long hiking cycle, as reported by Reuters to avoid further calamity in economic prospects. Investors should note that the New Zealand economy has already entered into a recession.

NZD/USD is forming an Inverted Head and Shoulder chart pattern on a two-hour scale, which indicates a wide consolidation. A breakout of the neckline plotted from June 22 high around 0.6220 will result in a bullish reversal. The 50-period Exponential Moving Average (EMA) at 0.6179 is providing cushion to the New Zealand Dollar bulls.

The Relative Strength Index (RSI) (14) is oscillating in the 40.00-60.00, which indicates a sideways performance.

Going forward, a decisive break above June 22 high around 0.6220 will drive the asset towards June 14 high at 0.6236 followed by May 17 high at 0.6274.

Alternatively, a downside move below June 23 low at 0.6116 will expose the asset June 05 low at 0.6041. A slippage below the latter would expose the asset to psychological support at 0.6000.

NZD/USD two-hour chart

NZD/USD

Overview
Today last price0.6186
Today Daily Change-0.0013
Today Daily Change %-0.21
Today daily open0.6199
 
Trends
Daily SMA200.6163
Daily SMA500.6169
Daily SMA1000.6189
Daily SMA2000.6175
 
Levels
Previous Daily High0.6221
Previous Daily Low0.6153
Previous Weekly High0.6221
Previous Weekly Low0.6124
Previous Monthly High0.625
Previous Monthly Low0.599
Daily Fibonacci 38.2%0.6195
Daily Fibonacci 61.8%0.6179
Daily Pivot Point S10.6161
Daily Pivot Point S20.6123
Daily Pivot Point S30.6093
Daily Pivot Point R10.6229
Daily Pivot Point R20.6259
Daily Pivot Point R30.6297

Author

Sagar Dua

Sagar Dua

FXStreet

Sagar Dua is associated with the financial markets from his college days. Along with pursuing post-graduation in Commerce in 2014, he started his markets training with chart analysis.

More from Sagar Dua
Share:

Editor's Picks

EUR/USD faces some resistance near 100-SMA on H4, around 1.1830 zone

The EUR/USD pair gains some follow-through positive traction for the second consecutive day and climbs to the 1.1830 region during the Asian session on Thursday. The US Dollar remains on the back foot amid concerns about the economic fallout from US President Donald Trump's erratic trade policies and acts as a tailwind for spot prices.

GBP/USD extends recovery to near 20-day EMA as US Dollar weakens

The Pound Sterling holds onto weekly gains around 1.3565 against the US Dollar during the Asian trading session on Thursday. The GBP/USD pair trades firmly as the US Dollar remains under pressure due to uncertainty surrounding the United States trade policy outlook.

Gold looks to build on strength beyond $5,200, eyes monthly peak amid safe-haven flows

Gold touches a fresh daily high heading into the European session on Thursday, with bulls looking to build on the momentum beyond the $5,200 mark. This marks the second straight day of a positive move and is supported by sustained safe-haven flows, bolstered by uncertainties surrounding US President Donald Trump's trade policies and US-Iran nuclear talks.

Stellar: Relief bounce fades as bearish undertone persists

Stellar is trading around $0.16 at the time of writing on Thursday after rebounding more than 8% in the previous day. Derivatives data paints a negative picture as XLM’s short bets hit a monthly high while Open Interest continues to decline.

Nvidia delivers another monster earnings report, and forecasts big things to come

It was another monster earnings report from Nvidia for fiscal Q4. Revenues were $68.1bn, smashing estimates of $65bn. Gross profit margin was a healthy 75%, up from 73.5% in the prior quarter, and the outlook for this quarter was monstrous.

Solana strikes key resistance with double-digit gains

Solana trades at $88 at press time on Thursday, after an 11% upswing the previous day within a broader consolidation range of roughly three weeks. Institutional demand for Solana heightens as US spot SOL Exchange Traded Funds record $30 million of inflow on Wednesday.