|

NZD/USD Price Analysis: Sits near multi-week top, bulls await a move beyond 61.8% Fibo.

  • NZD/USD holds steady near a multi-week high on Tuesday amid a weaker USD.
  • The technical setup favours bullish traders and supports prospects for further gains.
  • A convincing break below the 0.6100 mark is needed to negate the positive outlook.

The NZD/USD pair edges higher for the third successive day on Tuesday and trades around the 0.6215-0.6220 barrier or a nearly three-week high during the Asian session. 

Expectations that the Federal Reserve (Fed) might be nearing the end of its rate hiking cycle keep the US Dollar (USD) bulls on the defensive, which, in turn, acts as a tailwind for the NZD/USD pair. Market participants, however, seem reluctant to place aggressive bets ahead of the key central bank event risk - the Reserve Bank of New Zealand (RBNZ) policy meeting - and the release of the key US CPI report on Wednesday. 

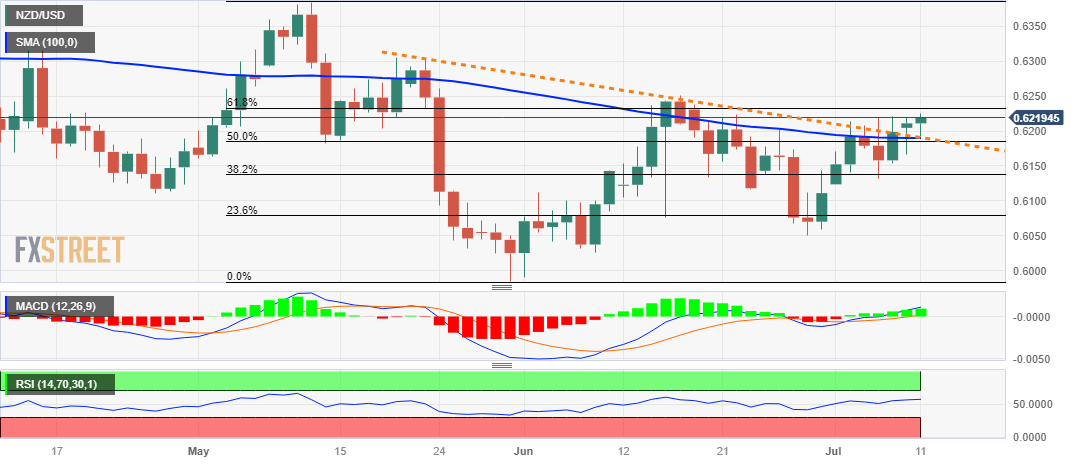
From a technical perspective, the recent breakout through a confluence resistance comprising the 100-day Simple Moving Average (SMA) and a descending trend-line suggests that the path of least resistance for the NZD/USD pair is to the upside. Adding to this, oscillators on the daily chart have just started gaining positive traction and validate the constructive setup, supporting prospects for further near-term gains. 

That said, it will still be prudent to wait for some follow-through buying beyond the June monthly peak, around the 0.6245-0.6250 region, which coincides with the 61.8% Fibonacci retracement level of the May-June downfall, before placing fresh bullish bets. The NZD/USD pair might then accelerate the momentum towards testing the 0.6285 intermediate hurdle before aiming to reclaim the 0.6300 round-figure mark.

On the flip side, the 0.6190-0.6185 confluence resistance breakpoint now seems to protect the immediate downside ahead of the 38.2% Fibo. level, around the 0.6140-0.6135 region. Any subsequent decline could attract some buying and remain cushioned near the 0.6100 mark. This is closely followed by 23.6% Fibo. level, around the 0.6080 region, below which the NZD/USD pair could slide to the 0.6000 psychological mark. 

Some follow-through selling below the YTD low, around the 0.5985 zone touched in June, should pave the way for a further near-term depreciating move. 

NZD/USD daily chart

fxsoriginal

Key levels to watch

NZD/USD

Overview
Today last price0.6217
Today Daily Change0.0006
Today Daily Change %0.10
Today daily open0.6211
 
Trends
Daily SMA200.6167
Daily SMA500.617
Daily SMA1000.6188
Daily SMA2000.6177
 
Levels
Previous Daily High0.622
Previous Daily Low0.6166
Previous Weekly High0.6221
Previous Weekly Low0.6124
Previous Monthly High0.625
Previous Monthly Low0.599
Daily Fibonacci 38.2%0.6199
Daily Fibonacci 61.8%0.6187
Daily Pivot Point S10.6178
Daily Pivot Point S20.6145
Daily Pivot Point S30.6124
Daily Pivot Point R10.6232
Daily Pivot Point R20.6253
Daily Pivot Point R30.6286

Author

Haresh Menghani

Haresh Menghani is a detail-oriented professional with 10+ years of extensive experience in analysing the global financial markets.

More from Haresh Menghani
Share:

Markets move fast. We move first.

Orange Juice Newsletter brings you expert driven insights - not headlines. Every day on your inbox.

By subscribing you agree to our Terms and conditions.

Editor's Picks

EUR/USD clings to small gains near 1.1750

Following a short-lasting correction in the early European session, EUR/USD regains its traction and clings to moderate gains at around 1.1750 on Monday. Nevertheless, the pair's volatility remains low, with investors awaiting this weeks key data releases from the US and the ECB policy announcements.

GBP/USD edges higher toward 1.3400 ahead of US data and BoE

GBP/USD reverses its direction and advances toward 1.3400 following a drop to the 1.3350 area earlier in the day. The US Dollar struggles to gather recovery momentum as markets await Tuesday's Nonfarm Payrolls data, while the Pound Sterling holds steady ahead of the BoE policy announcements later in the week.

Gold pulls away from session high, holds above $4,300

Gold loses its bullish momentum and retreats below $4,350 after testing this level earlier on Monday. XAU/USD, however, stays in positive territory as the US Dollar remains on the back foot on growing expectations for a dovish Fed policy outlook next year.

Solana consolidates as spot ETF inflows near $1 billion signal institutional dip-buying

Solana price hovers above $131 at the time of writing on Monday, nearing the upper boundary of a falling wedge pattern, awaiting a decisive breakout. On the institutional side, demand for spot Solana Exchange-Traded Funds remained firm, pushing total assets under management to nearly $1 billion since launch. 

Big week ends with big doubts

The S&P 500 continued to push higher yesterday as the US 2-year yield wavered around the 3.50% mark following a Federal Reserve (Fed) rate cut earlier this week that was ultimately perceived as not that hawkish after all. The cut is especially boosting the non-tech pockets of the market.

Solana Price Forecast: SOL consolidates as spot ETF inflows near $1 billion signal institutional dip-buying

Solana (SOL) price hovers above $131 at the time of writing on Monday, nearing the upper boundary of a falling wedge pattern, awaiting a decisive breakout.