NZD/USD Price Analysis: Seems to move below 0.6100 followed by January’s low


  • NZD/USD moves on a downward trajectory after softer Business NZ PMI data.
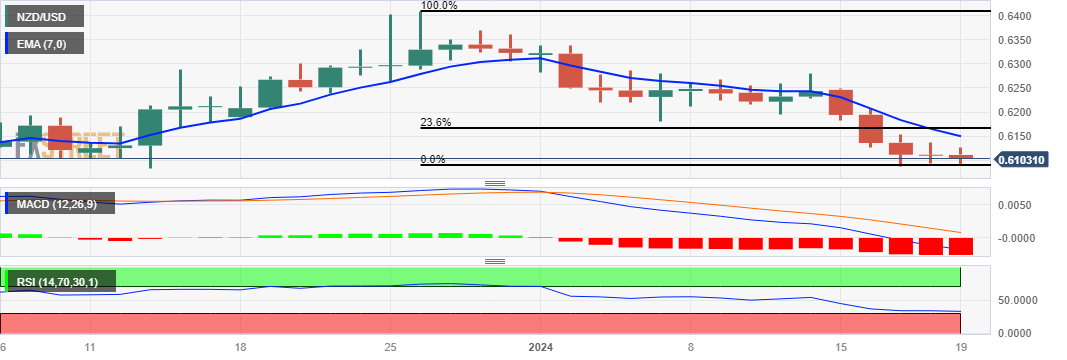
  • A breach below 0.6100 could lead the pair to retest January’s low at 0.6088.
  • The seven-day EMA at 0.6150 could act as an obstacle followed by the 23.6% Fibonacci retracement level at 0.6165.

NZD/USD continues its losing streak for the fifth straight session, trading lower near 0.6110 during the European session on Friday. The Business NZ Performance of Manufacturing Index (PMI) disclosed a decline in business activity within New Zealand's manufacturing sector, registering a figure of 43.1 in December compared to the previous reading of 46.5. This softer-than-expected result exerted downward pressure on the New Zealand Dollar (NZD), subsequently impacting the NZD/USD pair.

The technical analysis for the NZD/USD pair suggests a bearish sentiment in the market with the placement of the Moving Average Convergence Divergence (MACD) line below the centreline and exhibiting divergence below the signal line.

Additionally, the lagging indicator 14-day Relative Strength Index (RSI), is positioned below the 50 level, which signals a confirmation of the weaker momentum for the NZD/USD pair.

The NZD/USD pair finds immediate support at the psychological level at 0.6100. A firm break below the latter could put downward pressure on the pair to revisit January’s low at 0.6088 followed by the major support at 0.6050 level.

On the upside, the seven-day Exponential Moving Average (EMA) at 0.6150 could act as the key barrier for the NZD/USD pair. If the pair surpasses the seven-day EMA, it could provide support to underpinning the NZD/USD pair to explore the region around 23.6% Fibonacci retracement level at 0.6165 followed by the psychological resistance level at 0.6200.

NZD/USD: Daily Chart:

NZD/USD: Additional technical levels

Overview
Today last price 0.6106
Today Daily Change -0.0005
Today Daily Change % -0.08
Today daily open 0.6111
 
Trends
Daily SMA20 0.6247
Daily SMA50 0.6166
Daily SMA100 0.604
Daily SMA200 0.609
 
Levels
Previous Daily High 0.6137
Previous Daily Low 0.6094
Previous Weekly High 0.6279
Previous Weekly Low 0.6196
Previous Monthly High 0.641
Previous Monthly Low 0.6084
Daily Fibonacci 38.2% 0.611
Daily Fibonacci 61.8% 0.6121
Daily Pivot Point S1 0.6091
Daily Pivot Point S2 0.6071
Daily Pivot Point S3 0.6048
Daily Pivot Point R1 0.6134
Daily Pivot Point R2 0.6157
Daily Pivot Point R3 0.6177


Share: Feed news

Information on these pages contains forward-looking statements that involve risks and uncertainties. Markets and instruments profiled on this page are for informational purposes only and should not in any way come across as a recommendation to buy or sell in these assets. You should do your own thorough research before making any investment decisions. FXStreet does not in any way guarantee that this information is free from mistakes, errors, or material misstatements. It also does not guarantee that this information is of a timely nature. Investing in Open Markets involves a great deal of risk, including the loss of all or a portion of your investment, as well as emotional distress. All risks, losses and costs associated with investing, including total loss of principal, are your responsibility. The views and opinions expressed in this article are those of the authors and do not necessarily reflect the official policy or position of FXStreet nor its advertisers. The author will not be held responsible for information that is found at the end of links posted on this page.

If not otherwise explicitly mentioned in the body of the article, at the time of writing, the author has no position in any stock mentioned in this article and no business relationship with any company mentioned. The author has not received compensation for writing this article, other than from FXStreet.

FXStreet and the author do not provide personalized recommendations. The author makes no representations as to the accuracy, completeness, or suitability of this information. FXStreet and the author will not be liable for any errors, omissions or any losses, injuries or damages arising from this information and its display or use. Errors and omissions excepted.

The author and FXStreet are not registered investment advisors and nothing in this article is intended to be investment advice.

XM
Account
7.2
Tools
9.2
Service
9.4
Trading
9.0
Trust
7.0
Experience
8.4
Read review
Moneta Markets
Account
7.4
Tools
6.6
Service
8.0
Trading
6.6
Trust
5.2
Experience
9.2
Read review
Trading Pro
Account
7.2
Tools
5.2
Service
6.6
Trading
8.0
Trust
5.0
Experience
7.0
Read review
Pepperstone
Account
8.2
Tools
8.2
Service
7.4
Trading
9.0
Trust
8.8
Experience
9.0
Read review
XM
Read review
Moneta Markets
Read review
Trading Pro
Read review
Pepperstone
Read review
Trading Pro
Read review
Pepperstone
Read review
XM
Read review
Moneta Markets
Read review
Trading Pro
Account
7.2
Tools
5.2
Service
6.6
Trading
8.0
Trust
5.0
Experience
7.0
Read review
Pepperstone
Account
8.2
Tools
8.2
Service
7.4
Trading
9.0
Trust
8.8
Experience
9.0
Read review
XM
Account
7.2
Tools
9.2
Service
9.4
Trading
9.0
Trust
7.0
Experience
8.4
Read review
Moneta Markets
Account
7.4
Tools
6.6
Service
8.0
Trading
6.6
Trust
5.2
Experience
9.2
Read review

Recommended content


Recommended content

Editors’ Picks

Gold moves to record highs past $3,340

Gold moves to record highs past $3,340

Gold now gathers extra steam and advances beyond the $3,340 mark per troy ounce on Wednesday, hitting all-time highs amid ongoing worries over escalating US-China trade tensions, a weaker US Dollar and lack of news from Powell's speech.

Gold News
AUD/USD: Upside now refocuses the 200-day SMA

AUD/USD: Upside now refocuses the 200-day SMA

AUD/USD advanced for the sixth consecutive daily advance, picking up extra upside impulse on the back of the continuation of the sell-off in the US Dollar. Next on tap for the Aussie now emerges the yearly peak above 0.6400 prior to the key 200-day SMA.

AUD/USD News
EUR/USD looks to retest its 2025 highs

EUR/USD looks to retest its 2025 highs

EUR/USD reversed two consecutive daily retracements and revisited the key 1.1400 neighbourhood as the selling bias in the Greenback gathered extra pace, always against the backdrop of rising uncertainty surrounding US yields. Chief Powell, in the meantime, delivered a neutral message in his discussion over the economic outlook.

EUR/USD News
Bitcoin held steady as US reveals China faces up to 245% tariffs

Bitcoin held steady as US reveals China faces up to 245% tariffs

Bitcoin (BTC) witnessed little pressure on Wednesday despite the Chinese government selling off parts of its confiscated cryptocurrency holdings.

Read more
Future-proofing portfolios: A playbook for tariff and recession risks

Future-proofing portfolios: A playbook for tariff and recession risks

It does seem like we will be talking tariffs for a while. And if tariffs stay — in some shape or form — even after negotiations, we’ll likely be talking about recession too. Higher input costs, persistent inflation, and tighter monetary policy are already weighing on global growth. 

Read more
The Best brokers to trade EUR/USD

The Best brokers to trade EUR/USD

SPONSORED Discover the top brokers for trading EUR/USD in 2025. Our list features brokers with competitive spreads, fast execution, and powerful platforms. Whether you're a beginner or an expert, find the right partner to navigate the dynamic Forex market.

Read More

Forex MAJORS

Cryptocurrencies

Signatures

Best Brokers of 2025