|

NZD/USD Price Analysis: RSI conditions, key technical levels prod Kiwi bears below 0.6200

  • NZD/USD stays pressured at the lowest level in three weeks, down for the third consecutive day.
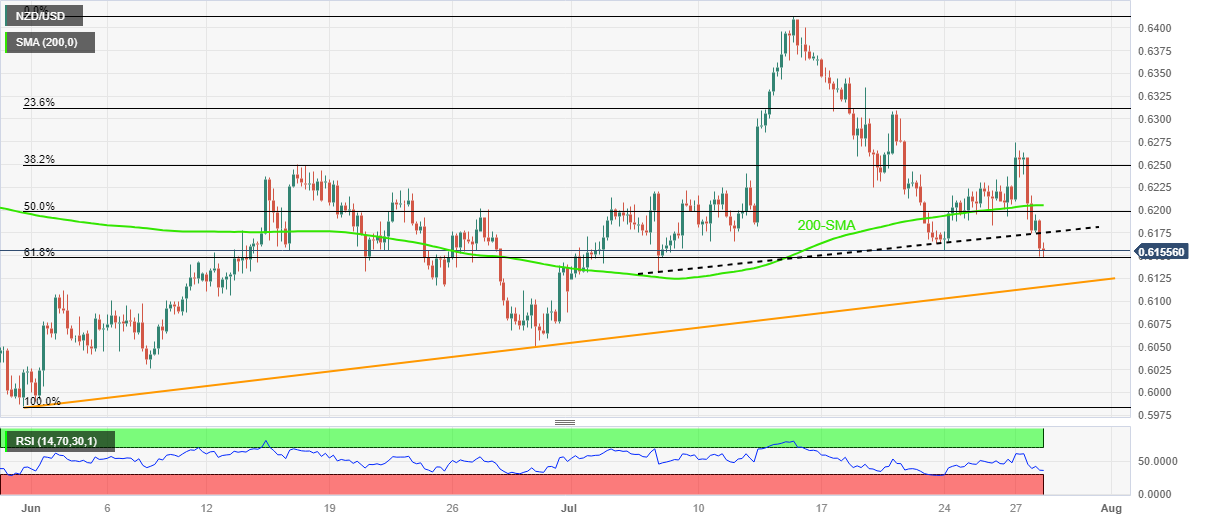
  • Downside break of 200-SMA, short-term key support line favor Kiwi bears.
  • 61.8% Fibonacci retracement level, rising trend line from late May can test further downside amid oversold RSI.

NZD/USD remains depressed at the lowest level in three weeks, down half a percent near 0.6155 heading into Friday’s European session. In doing so, the Kiwi pair drops for the third consecutive day while justifying the downside break of the 200-SMA and an upward-sloping trend line from July 06.

It’s worth noting, however, that the market’s cautious mood ahead of the Fed’s favorite inflation gauge, namely the Core Personal Consumption Expenditure (PCE) Price Index for June, expected 4.2% YoY versus 4.6% prior, restricts the NZD/USD pair’s immediate fall.

Also limiting the Kiwi pair’s further downside is the oversold RSI and the 61.8% Fibonacci retracement level of its upside from late May to mid-July, close to 0.6150.

Even if the quote breaks the key Fibonacci retracement level surrounding 0.6150, often termed the golden Fibonacci ratio, the NZD/USD pair’s slump isn’t guaranteed as an ascending support line from late May, close to 0.6115, will act as the final defense of the bulls.

Meanwhile, NZD/USD recovery remains elusive below the three-week-long support-turned-resistance line, around 0.6180 by the press time.

Following that, the 200-SMA level of around 0.6205 and the weekly high surrounding 0.6275 could check the Kiwi pair buyers before giving them control.

NZD/USD: Four-hour chart

Trend: Further downside expected

Additional important levels

Overview
Today last price0.6157
Today Daily Change-0.0026
Today Daily Change %-0.42%
Today daily open0.6183
 
Trends
Daily SMA200.6227
Daily SMA500.6167
Daily SMA1000.6198
Daily SMA2000.6217
 
Levels
Previous Daily High0.6274
Previous Daily Low0.6174
Previous Weekly High0.637
Previous Weekly Low0.6163
Previous Monthly High0.625
Previous Monthly Low0.599
Daily Fibonacci 38.2%0.6212
Daily Fibonacci 61.8%0.6236
Daily Pivot Point S10.6147
Daily Pivot Point S20.611
Daily Pivot Point S30.6047
Daily Pivot Point R10.6247
Daily Pivot Point R20.631
Daily Pivot Point R30.6347

Author

Anil Panchal

Anil Panchal

FXStreet

Anil Panchal has nearly 15 years of experience in tracking financial markets. With a keen interest in macroeconomics, Anil aptly tracks global news/updates and stays well-informed about the global financial moves and their implications.

More from Anil Panchal
Share:

Markets move fast. We move first.

Orange Juice Newsletter brings you expert driven insights - not headlines. Every day on your inbox.

By subscribing you agree to our Terms and conditions.

Editor's Picks

EUR/USD clings to small gains near 1.1750

Following a short-lasting correction in the early European session, EUR/USD regains its traction and clings to moderate gains at around 1.1750 on Monday. Nevertheless, the pair's volatility remains low, with investors awaiting this weeks key US data releases and the ECB policy announcements.

GBP/USD edges higher toward 1.3400 as traders await key data and BoE

GBP/USD reverses its direction and advances toward 1.3400 following a drop to the 1.3350 area earlier in the day. The US Dollar struggles to gather recovery momentum as markets await Tuesday's Nonfarm Payrolls data, while the Pound Sterling holds steady ahead of the BoE policy announcements later in the week.

Gold builds on previous week's gains, approaches $4,350

Gold preserves its bullish momentum after rising more than 2% last week and climbs toward $4,350 on Monday. The precious metal extends its upside as the US Dollar remains on the back foot on growing expectations for a dovish Fed policy outlook next year.

Solana consolidates as spot ETF inflows near $1 billion signal institutional dip-buying

Solana price hovers above $131 at the time of writing on Monday, nearing the upper boundary of a falling wedge pattern, awaiting a decisive breakout. On the institutional side, demand for spot Solana Exchange-Traded Funds remained firm, pushing total assets under management to nearly $1 billion since launch. 

Big week ends with big doubts

The S&P 500 continued to push higher yesterday as the US 2-year yield wavered around the 3.50% mark following a Federal Reserve (Fed) rate cut earlier this week that was ultimately perceived as not that hawkish after all. The cut is especially boosting the non-tech pockets of the market.

Solana Price Forecast: SOL consolidates as spot ETF inflows near $1 billion signal institutional dip-buying

Solana (SOL) price hovers above $131 at the time of writing on Monday, nearing the upper boundary of a falling wedge pattern, awaiting a decisive breakout.