|

NZD/USD Price Analysis: Retreats from the three-month highs, stays above 0.6150

  • NZD/USD trims intraday gains as US Dollar attempts to rebound.
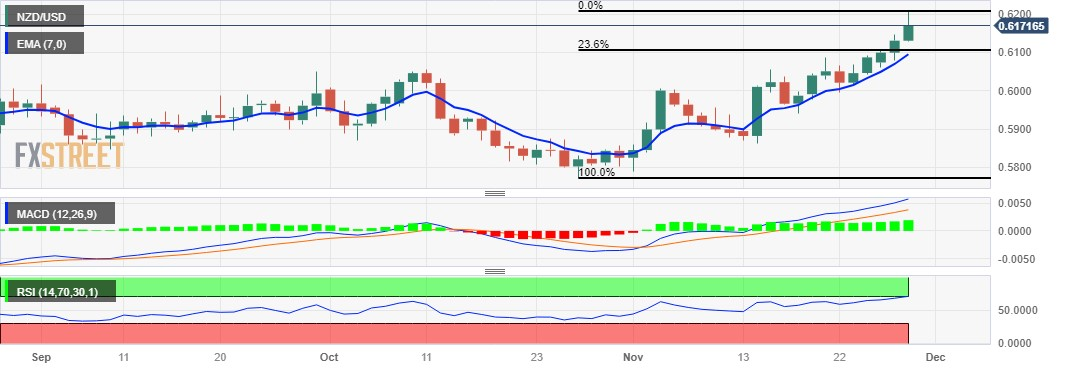
  • Technical indicators suggest revisiting psychological resistance at 0.6200 aligned with the three-month high.
  • A break below 0.6150 could push the pair to test 23.6% Fibo before the 0.6100 psychological support.

NZD/USD retraces its intraday gains as the US Dollar rebounds during the early European session on Wednesday. However, the NZD/USD pair received upward support after the release of the Reserve Bank of New Zealand (RBNZ) interest rate decision. RBNZ board members decided to keep the interest rate steady at 5.50%. This decision aligns with widespread expectations in the market.

The NZD/USD trades higher near 0.6160 at the time of writing. The 14-day Relative Strength Index (RSI) is above the 50 level, indicating a bullish sentiment for the NZD/USD pair.

This could encourage bulls of the pair to retest the psychological resistance region around 0.6200 aligned with the three-month high at 0.6208.

A breakthrough above the resistance area could support the NZD/USD pair to approach August’s high at 0.6217.

Moreover, the Moving Average Convergence Divergence (MACD) line, situated above the centerline and the signal line, could be a confirmation of bullish momentum in the market.

On the downside, a break below the major support level of 0.6150 could push the pair to fall to the 23.6% Fibonacci retracement at 0.6105 lined up with the psychological support at 0.6100 before the seven-day Exponential Moving Average (EMA) at 0.6092.

NZD/USD: Daily Chart:

NZD/USD: other technical levels to watch

Overview
Today last price0.616
Today Daily Change0.0029
Today Daily Change %0.47
Today daily open0.6131
 
Trends
Daily SMA200.5984
Daily SMA500.5941
Daily SMA1000.5992
Daily SMA2000.609
 
Levels
Previous Daily High0.6148
Previous Daily Low0.6079
Previous Weekly High0.6092
Previous Weekly Low0.5978
Previous Monthly High0.6056
Previous Monthly Low0.5772
Daily Fibonacci 38.2%0.6122
Daily Fibonacci 61.8%0.6105
Daily Pivot Point S10.6091
Daily Pivot Point S20.605
Daily Pivot Point S30.6022
Daily Pivot Point R10.616
Daily Pivot Point R20.6188
Daily Pivot Point R30.6229

Author

Akhtar Faruqui

Akhtar Faruqui is a Forex Analyst based in New Delhi, India. With a keen eye for market trends and a passion for dissecting complex financial dynamics, he is dedicated to delivering accurate and insightful Forex news and analysis.

More from Akhtar Faruqui
Share:

Editor's Picks

EUR/USD weakens below 1.1700 as Middle East tensions drive US Dollar strength

The EUR/USD pair trades with mild losses around 1.1685, the lowest since late January, during the early Asian session on Tuesday. The US Dollar gathers strength against the Euro as escalating tensions in the Middle East boost safe-haven currencies. The preliminary reading of the Harmonized Index of Consumer Prices from the Eurozone will be published later on Tuesday.  

GBP/USD hits new yearly lows near 1.3300

GBP/USD adds to the recent bearish tone, approaching to the key 1.3300 support to reach fresh YTD troughs against the backdrop of the robust performance of the US Dollar. Indeed, Cable’s decline comes amid the firm demand for the safe-haven space in the wake of the US and Israel attacks to Iran.

Gold defends bids as US-Iran war continues to fuel safe-haven flows

Gold retains positive bias for the fifth consecutive day on Tuesday as rising geopolitical tensions in the Middle East continue to underpin safe-haven assets. However, a bullish US Dollar keeps the bullion below its highest level since late January, set on Monday, warranting caution before positioning for any further appreciation.

Strategy lifts holdings to 3.4% of Bitcoin's total supply amid inflows into crypto products

Strategy continued its accumulation of the top crypto last week, acquiring 3,015 BTC for $204 million amid renewed interest in crypto products after four weeks of outflows.

The market is not panicking it is repricing the probability distribution of Oil and time

At the end of the day, markets do not trade morality or geopolitics. They trade transmission channels. And the only channel that truly matters in this maelstrom runs through the price of energy and the time value of money.

Grass 20% bullish breakout defies broader market weakness

Grass (GRASS) is edging up above $0.30 at the time of writing on Monday. The token’s notable 20% intraday surge stands out amid heightened volatility in the broader crypto market.