- NZD/USD has remained lackluster despite the release of solid China Trade Balance data.
- China’s annual Imports have contracted by 1.4% while Exports have expanded significantly by 14.8%.
- The Kiwi asset has been in a negative trajectory after a breakdown of the Rising Channel.
The NZD/USD pair is displaying back-and-forth moves in a narrow range of 0.6210-0.6220 in the Asian session. The Kiwi asset has turned sideways as the US Dollar Index has shown some recovery after an intense sell-off. Also, upbeat China’s international trade data (March) has failed to infuse blood into the New Zealand Dollar.
China’s Trade Balance data (in US Dollars) has landed at $88.19B, significantly higher than the consensus of $39.2B but lower than the former release of $116.8 B. Annual Imports have contracted by 1.4% while the street was expecting a contraction of 5%. However, Exports have expanded significantly by 14.8% against a contraction of 7.0% as expected.
It is worth noting that New Zealand is one of the leading trading partners of China and a lower-than-expected contraction in Chinese Imports would be supportive of the New Zealand Dollar.
Meanwhile, the USD Index is making efforts for keeping its feet steady above 101.50.
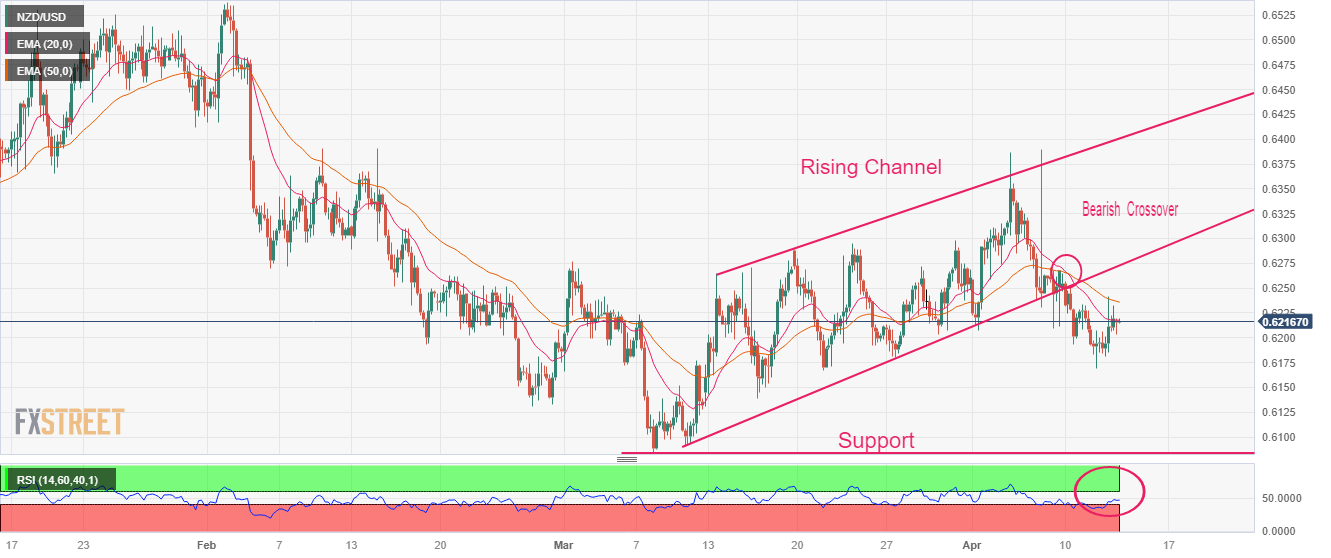
The New Zealand Dollar has been in a negative trajectory after a breakdown of the Rising Channel chart pattern formed on a four-hour scale. Also, the 20-and 50-period Exponential Moving Averages (EMAs) at 0.6217 and 0.6236 respectively are acting as barricades for the New Zealand Dollar. Potential horizontal support is plotted from March 08 low at 0.6084.
The Relative Strength Index (RSI) (14) has shifted into the 40.00-60.00 range from the bearish range of 20.00-40.00, which indicates a loss in the downside momentum..
A downside will be witnessed if the Kiwi asset surrenders April 11 low near 0.6170, which will drag the major to March 15 low at 0.6139 followed by March 08 low at 0.6084.
Alternatively, a decisive upside move above February 07 high at 0.6363 will expose the Kiwi asset to the round-level resistance at 0.6400 and December 05 high at 0.6443.
NZD/USD four-hour chart
Information on these pages contains forward-looking statements that involve risks and uncertainties. Markets and instruments profiled on this page are for informational purposes only and should not in any way come across as a recommendation to buy or sell in these assets. You should do your own thorough research before making any investment decisions. FXStreet does not in any way guarantee that this information is free from mistakes, errors, or material misstatements. It also does not guarantee that this information is of a timely nature. Investing in Open Markets involves a great deal of risk, including the loss of all or a portion of your investment, as well as emotional distress. All risks, losses and costs associated with investing, including total loss of principal, are your responsibility. The views and opinions expressed in this article are those of the authors and do not necessarily reflect the official policy or position of FXStreet nor its advertisers. The author will not be held responsible for information that is found at the end of links posted on this page.
If not otherwise explicitly mentioned in the body of the article, at the time of writing, the author has no position in any stock mentioned in this article and no business relationship with any company mentioned. The author has not received compensation for writing this article, other than from FXStreet.
FXStreet and the author do not provide personalized recommendations. The author makes no representations as to the accuracy, completeness, or suitability of this information. FXStreet and the author will not be liable for any errors, omissions or any losses, injuries or damages arising from this information and its display or use. Errors and omissions excepted.
The author and FXStreet are not registered investment advisors and nothing in this article is intended to be investment advice.
Recommended content
Editors’ Picks

Gold gives away some gains, slips back to $2,980
Gold retraced from its earlier all-time highs above the key $3,000 mark on Friday, finding a footing around $2,980 per troy ounce. Profit-taking, rising US yields, and a shift to a risk-on environment seem to be putting the brakes on further gains for the metal.

EUR/USD remains firm and near the 1.0900 barrier
EUR/USD is finding its footing and trading comfortably in positive territory as the week wraps up, shaking off two consecutive daily pullbacks and setting its sights back on the pivotal 1.0900 mark—and beyond.

GBP/USD remains depressed, treads water in the low-1.2900s
GBP/USD is holding steady in consolidation territory after Friday’s opening bell on Wall Street, hovering in the low-1.2900 range. This resilience comes despite disappointing UK data and persistent selling pressure on the USD.

Crypto Today: BNB, OKB, BGB tokens rally as BTC, Shiba Inu and Chainlink lead market rebound
Cryptocurrencies sector rose by 0.13% in early European trading on Friday, adding $352 million in aggregate valuation. With BNB, OKB and BGB attracting demand amid intense market volatility, the exchange-based native tokens sector added $1.9 billion.

Week ahead – Central banks in focus amid trade war turmoil
Fed decides on policy amid recession fears. Yen traders lock gaze on BoJ for hike signals. SNB seen cutting interest rates by another 25bps. BoE to stand pat after February’s dovish cut.

The Best brokers to trade EUR/USD
SPONSORED Discover the top brokers for trading EUR/USD in 2025. Our list features brokers with competitive spreads, fast execution, and powerful platforms. Whether you're a beginner or an expert, find the right partner to navigate the dynamic Forex market.