NZD/USD Price Analysis: Rebounds from 0.6150 support confluence but 200-EMA, US NFP will prod Kiwi bulls


  • NZD/USD picks up bids to refresh intraday high, prints the first daily gain in three.
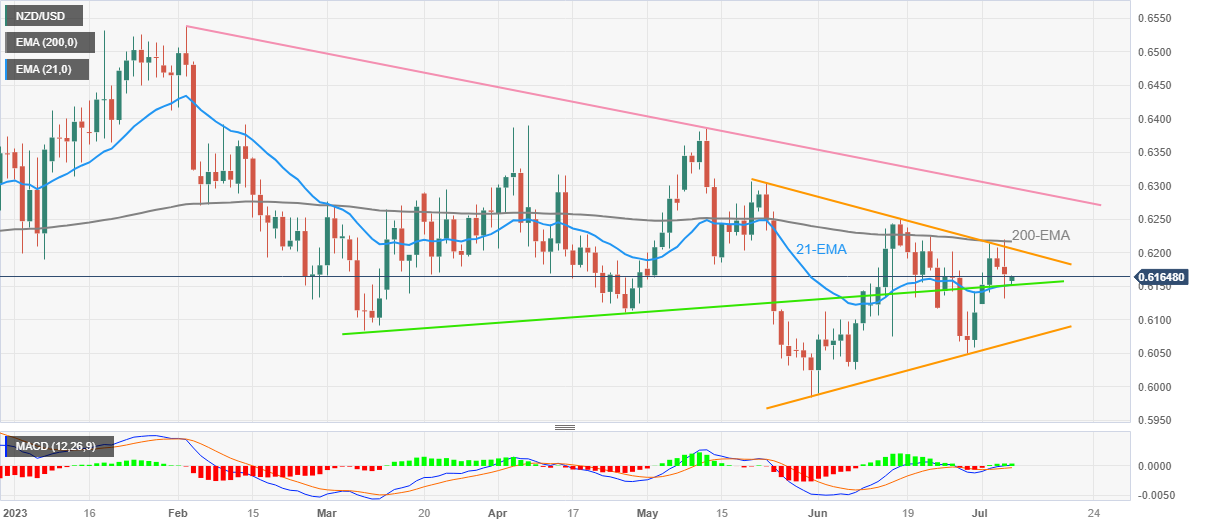
  • Convergence of 21-EMA, four-month-old rising trend line puts a floor under Kiwi price.
  • Seven-week-old symmetrical triangle limits short-term moves, 200-EMA adds to upside filters.
  • Sellers have a bumpy road towards the south unless breaking 0.5985; US NFP eyed.

NZD/USD refreshes intraday high around 0.6165 as it reverses losses made in the last two days amid early Friday in Auckland. In doing so, the Kiwi pair bounces off a short-term key support confluence comprising the 21-Exponential Moving Average (EMA), as well as an upward-sloping support line from early March.

The latest rebound of the Antipodeans can be considered as the positioning for the US employment report for June, including the Nonfarm Payrolls (NFP). That said, the bullish MACD signals also underpin the pair’s recovery.

Also read: NZD/USD slides towards 0.6155 following strong US data

However, a seven-week-old symmetrical triangle, currently between 0.6210 and 0.6065, restricts the NZD/USD pair’s short-term moves.

Even if the quote defies the triangle formation by crossing the 0.6210 hurdle, the 200-EMA level of around 0.6220 will challenge the pair buyers before giving them control.

It’s worth noting that the US jobs report need to support the quote’s upside break of the 200-EMA to convince the NZD/USD bulls.

On the flip side, a daily closing below the 0.6150 support confluence comprising the 21-EMA and the aforementioned multi-day-old rising trend line could drag the quote towards the 0.6100 round figure before directing it to the stated triangle’s bottom line surrounding 0.6065.

Following that, multiple supports near 0.6030, the 0.6000 psychological magnet and the yearly low marked in May around 0.5985 could challenge the NZD/USD bears.

NZD/USD: Daily chart

Trend: Limited recovery expected

Additional important levels

Overview
Today last price 0.6167
Today Daily Change -0.0012
Today Daily Change % -0.19%
Today daily open 0.6179
 
Trends
Daily SMA20 0.6157
Daily SMA50 0.6169
Daily SMA100 0.619
Daily SMA200 0.6169
 
Levels
Previous Daily High 0.6208
Previous Daily Low 0.6175
Previous Weekly High 0.6202
Previous Weekly Low 0.605
Previous Monthly High 0.625
Previous Monthly Low 0.599
Daily Fibonacci 38.2% 0.6188
Daily Fibonacci 61.8% 0.6195
Daily Pivot Point S1 0.6167
Daily Pivot Point S2 0.6154
Daily Pivot Point S3 0.6134
Daily Pivot Point R1 0.62
Daily Pivot Point R2 0.622
Daily Pivot Point R3 0.6233


Share: Feed news

Information on these pages contains forward-looking statements that involve risks and uncertainties. Markets and instruments profiled on this page are for informational purposes only and should not in any way come across as a recommendation to buy or sell in these assets. You should do your own thorough research before making any investment decisions. FXStreet does not in any way guarantee that this information is free from mistakes, errors, or material misstatements. It also does not guarantee that this information is of a timely nature. Investing in Open Markets involves a great deal of risk, including the loss of all or a portion of your investment, as well as emotional distress. All risks, losses and costs associated with investing, including total loss of principal, are your responsibility. The views and opinions expressed in this article are those of the authors and do not necessarily reflect the official policy or position of FXStreet nor its advertisers. The author will not be held responsible for information that is found at the end of links posted on this page.

If not otherwise explicitly mentioned in the body of the article, at the time of writing, the author has no position in any stock mentioned in this article and no business relationship with any company mentioned. The author has not received compensation for writing this article, other than from FXStreet.

FXStreet and the author do not provide personalized recommendations. The author makes no representations as to the accuracy, completeness, or suitability of this information. FXStreet and the author will not be liable for any errors, omissions or any losses, injuries or damages arising from this information and its display or use. Errors and omissions excepted.

The author and FXStreet are not registered investment advisors and nothing in this article is intended to be investment advice.

Recommended content


Recommended content

Editors’ Picks

EUR/USD gathers traction toward 1.0450 amid US Dollar weakness

EUR/USD gathers traction toward 1.0450 amid US Dollar weakness

EUR/USD regains upside traction and nears 1.0450 in the European trading hours on Thursday. Broad US Dollar weakness supports the pair. However, tariff threats from US President Donald Trump and geopolitical tension might cap its upside. US data and Fedspeak remains in focus. 

EUR/USD News
Gold rallies with yields taking a step back

Gold rallies with yields taking a step back

Gold is printing another fresh all-time high at around $2,955. US President Donald Trump took markets by surprise when he mentioned a trade deal with China could be done. If US yields drop off further, expect to see more all-time highs in Gold this week.

Gold News
GBP/USD holds ground above 1.2600, awaits US data

GBP/USD holds ground above 1.2600, awaits US data

GBP/USD holds ground above 1.2600 in the European session on Thursday. The pair is helped by a sustained US Dollar weakness but broad risk-off mood due to renewed tariff threats from US President Donald Trump could limit the risk sensitive Pound Sterling. US data is next in focus. 

GBP/USD News
Stellar Price Forecast: XLM’s Total Value Locked reaches over $62 million

Stellar Price Forecast: XLM’s Total Value Locked reaches over $62 million

Stellar (XLM) price trades inside a channel pattern; a breakout indicates bullish momentum. Crypto intelligence tracker DefiLlama data shows that XLM’s TVL reaches $62 million while the technical outlook projects a target of $0.74.

Read more
Money market outlook 2025: Trends and dynamics in the Eurozone, US, and UK

Money market outlook 2025: Trends and dynamics in the Eurozone, US, and UK

We delve into the world of money market funds. Distinct dynamics are at play in the US, eurozone, and UK. In the US, repo rates are more attractive, and bills are expected to appreciate. It's also worth noting that the Fed might cut rates more than anticipated, similar to the UK. In the eurozone, unsecured rates remain elevated.

Read more
The Best brokers to trade EUR/USD

The Best brokers to trade EUR/USD

SPONSORED Discover the top brokers for trading EUR/USD in 2025. Our list features brokers with competitive spreads, fast execution, and powerful platforms. Whether you're a beginner or an expert, find the right partner to navigate the dynamic Forex market.

Read More

Forex MAJORS

Cryptocurrencies

Signatures

Best Brokers of 2025