- NZD/USD takes offers to refresh yearly low during eight-day downtrend.
- Oversold RSI, key technical levels can challenge Kiwi bears.
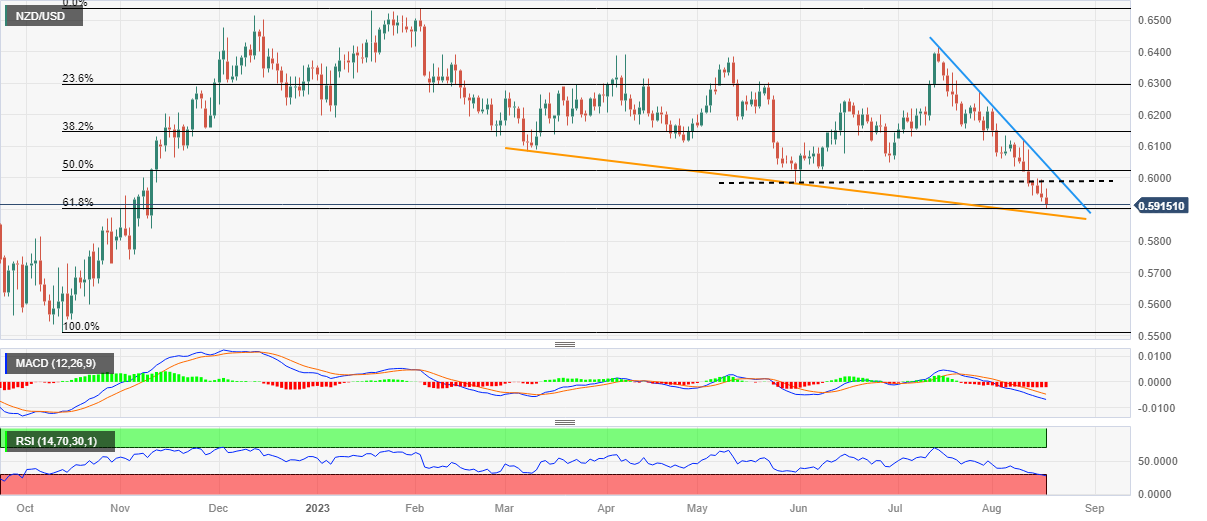
- Corrective bounce can aim for May’s bottom but remains elusive below 0.6045.
NZD/USD bears keep the reins for the eighth consecutive day as they refresh the yearly low to 0.5902 amid early Thursday.
In doing so, the Kiwi pair justifies the previous week’s downside break of the 0.5985 support comprising May’s low while poking the 61.8% Fibonacci retracement of October 2022 to February 2023 upside, near 0.5900 by the press time, also known as the golden Fibonacci ratio.
It’s worth noting, however, that the RSI (14) line hits the oversold territory and joins the key Fibonacci support around 0.5900 to challenge the NZD/USD bears.
Also acting as a downside filter is a descending support line from early March, close to 0.5885 by the press time.
In a case where the Kiwi pair drops below 0.5885, the early October swing high near 0.5815 may act as the final defense of the bulls.
Alternatively, an upside clearance of the support-turned-resistance line surrounding 0.5985, closely followed by the 0.6000 psychological magnet, becomes necessary for the NZD/USD buyers to return to the desk.
Even so, a downward-sloping resistance line from July 14, around 0.6045 at the latest, can challenge the run-up before pushing back the bears.
NZD/USD: Daily chart
Trend: Limited downside expected
Information on these pages contains forward-looking statements that involve risks and uncertainties. Markets and instruments profiled on this page are for informational purposes only and should not in any way come across as a recommendation to buy or sell in these assets. You should do your own thorough research before making any investment decisions. FXStreet does not in any way guarantee that this information is free from mistakes, errors, or material misstatements. It also does not guarantee that this information is of a timely nature. Investing in Open Markets involves a great deal of risk, including the loss of all or a portion of your investment, as well as emotional distress. All risks, losses and costs associated with investing, including total loss of principal, are your responsibility. The views and opinions expressed in this article are those of the authors and do not necessarily reflect the official policy or position of FXStreet nor its advertisers. The author will not be held responsible for information that is found at the end of links posted on this page.
If not otherwise explicitly mentioned in the body of the article, at the time of writing, the author has no position in any stock mentioned in this article and no business relationship with any company mentioned. The author has not received compensation for writing this article, other than from FXStreet.
FXStreet and the author do not provide personalized recommendations. The author makes no representations as to the accuracy, completeness, or suitability of this information. FXStreet and the author will not be liable for any errors, omissions or any losses, injuries or damages arising from this information and its display or use. Errors and omissions excepted.
The author and FXStreet are not registered investment advisors and nothing in this article is intended to be investment advice.
Recommended content
Editors’ Picks

EUR/USD remains near 1.0400 post-US PCE
The US Dollar’s inconclusive price action allows some recovery in EUR/USD, keeping the pair around the 1.0400 region following the release of PCE inflation data for the month of January.

Gold slumps to fresh multi-week lows below $2,840
Gold stays under bearish pressure and trades at its lowest level in three weeks below $2,840. The uncertainty surrounding the Trump administration's trade policy and month-end flows seem to be weighing on XAU/USD, which remains on track to snap an eight-week winning streak.

GBP/USD clings to gains just above 1.2600 after PCE data
GBP/USD remains positively oriented in the 1.2600 neighbourhood as the Greenback is navigating a vacillating range following the PCE inflation release.

The week ahead – US Payrolls, ECB rate meeting, ITV results – W/c 3rd March
Having seen the Federal Reserve keep rates on hold last month the US labour market continues to show remarkable resilience, despite seeing a slowdown in hiring in January, after a blow out December number.

Weekly focus – Tariff fears are back on the agenda
While the timing of the EU measures remains still uncertain, Trump surprised markets on Thursday by signalling that the 25% tariffs on Canada and Mexico will be enacted when the one-month delay runs out next Tuesday.

The Best brokers to trade EUR/USD
SPONSORED Discover the top brokers for trading EUR/USD in 2025. Our list features brokers with competitive spreads, fast execution, and powerful platforms. Whether you're a beginner or an expert, find the right partner to navigate the dynamic Forex market.