|

NZD/USD Price Analysis: Pair extended its decline and tallies a five-day losing streak

  • NZD/USD fell by 0.23% on Tuesday, slipping to 0.5830.
  • Pair extended its decline and tallied a five-day losing streak, striking a fresh low below 0.5800, its lowest in over a year.
  • Indicators warn about oversold conditions, which might push the pair somewhat upwards.

The NZD/USD plunged by 0.23% to 0.5830 in Tuesday's session, marking its fifth consecutive day in the red. This decline saw the pair set a new low below 0.5800, its lowest level in over a year with indicators echoing an intenses bearish momentum.

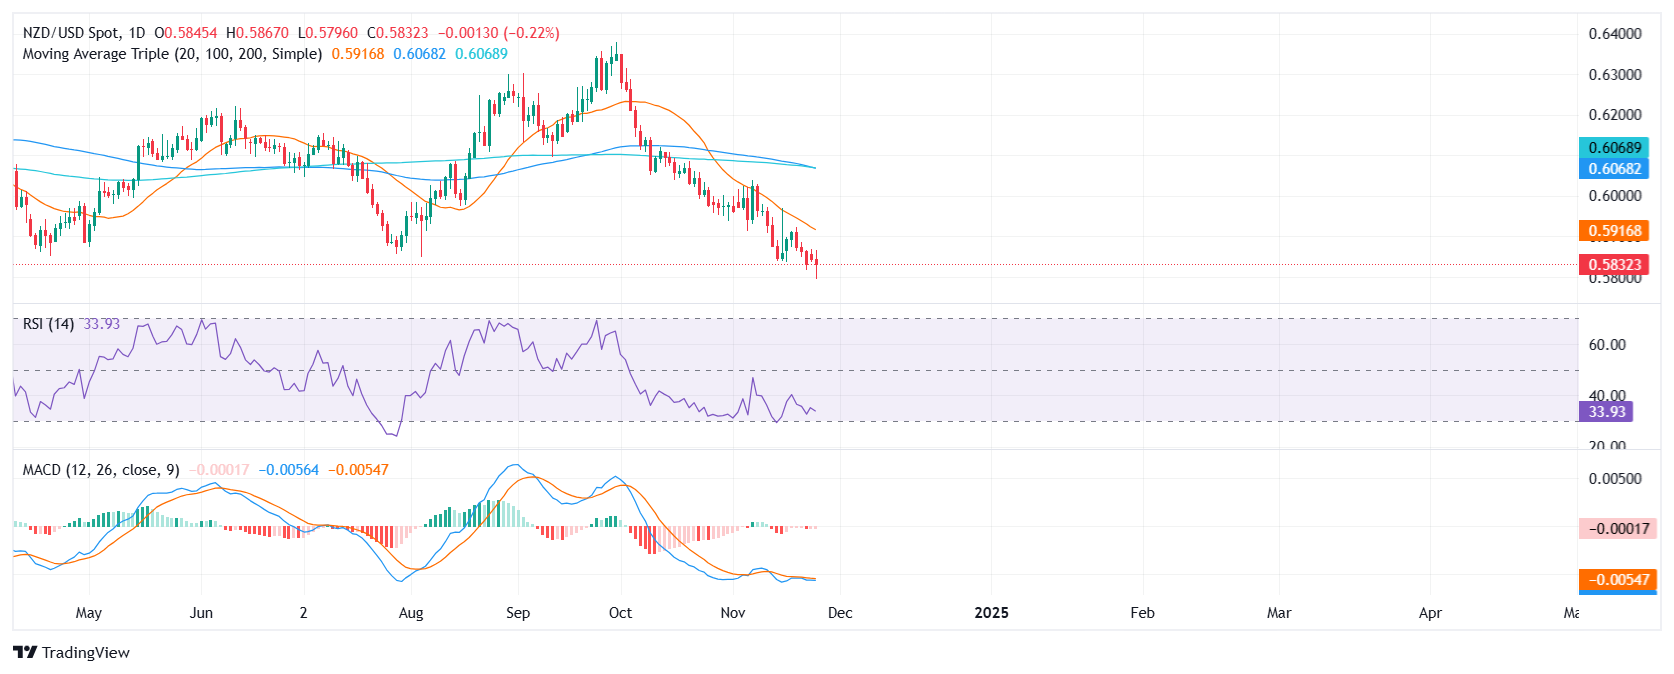
The technical analysis reveals a bearish picture for the NZD/USD pair. The key indicators depict mounting selling pressure, accentuating the bearish outlook. The Relative Strength Index (RSI), hovering in negative territory at 36, signifies the current selling sentiment. Similarly, the Moving Average Convergence Divergence (MACD) reinforces this bearish sentiment with its histogram transitioning to red and escalating.

Despite indicators hinting at oversold conditions suggesting a potential temporary upswing, the bears still dominate the pair's trajectory. Hence, a break below 0.5830 may exacerbate losses. The support levels of note are 0.5800, 0.5750, and 0.5730, while resistance stands at 0.5900, 0.5930, and 0.5950.

NZD/USD daily chart

Author

Patricio Martín

Patricio is an economist from Argentina passionate about global finance and understanding the daily movements of the markets.

More from Patricio Martín
Share:

Markets move fast. We move first.

Orange Juice Newsletter brings you expert driven insights - not headlines. Every day on your inbox.

By subscribing you agree to our Terms and conditions.

Editor's Picks

EUR/USD struggles to extend advance above 1.1800

The EUR/USD pair posts a fresh weekly low near 1.1740 during the Asian trading session on Wednesday. The major currency pair is under pressure as the US Dollar edges higher despite Federal Open Market Committee minutes of the December policy meeting, released on Tuesday, showing that most policymakers stressed the need for further interest rate cuts.

GBP/USD tests 1.3450 support after moving below nine-day EMA

GBP/USD remains subdued for the second consecutive day, trading around 1.3460 during the Asian hours on Wednesday. The technical analysis of the daily chart indicates a weakening of a bullish bias as the pair is positioned slightly below the lower boundary of the ascending channel pattern.

Gold jumps on US rate cut prospects, safe-haven demand

Gold price extends the rally above $4,350 during the early European trading hours on Wednesday. Gold's price has surged about 65% this year and is set to record its biggest annual gains since 1979. The rally in the precious metal is bolstered by the prospect of further US interest rate cuts in 2026. Lower interest rates could reduce the opportunity cost of holding Gold, supporting the non-yielding precious metal.

Bitcoin, Ethereum and XRP prepare for a potential New Year rebound

Bitcoin, Ethereum, and Ripple are holding steady on Wednesday after recording minor gains on the previous day. Technically, Bitcoin could extend gains within a triangle pattern while Ethereum and Ripple face critical overhead resistance. 

Economic outlook 2026-2027 in advanced countries: Solidity test

After a year marked by global economic resilience and ending on a note of optimism, 2026 looks promising and could be a year of solid economic performance. In our baseline scenario, we expect most of the supportive factors at work in 2025 to continue to play a role in 2026.

Crypto market outlook for 2026

Year 2025 was volatile, as crypto often is.  Among positive catalysts were favourable regulatory changes in the U.S., rise of Digital Asset Treasuries (DAT), adoption of AI and tokenization of Real-World-Assets (RWA).