|

NZD/USD Price Analysis: A break above 0.6000 could approach 14-day EMA, 23.6% Fibonacci

  • NZD/USD tests the psychological level of 0.6000 on Monday.
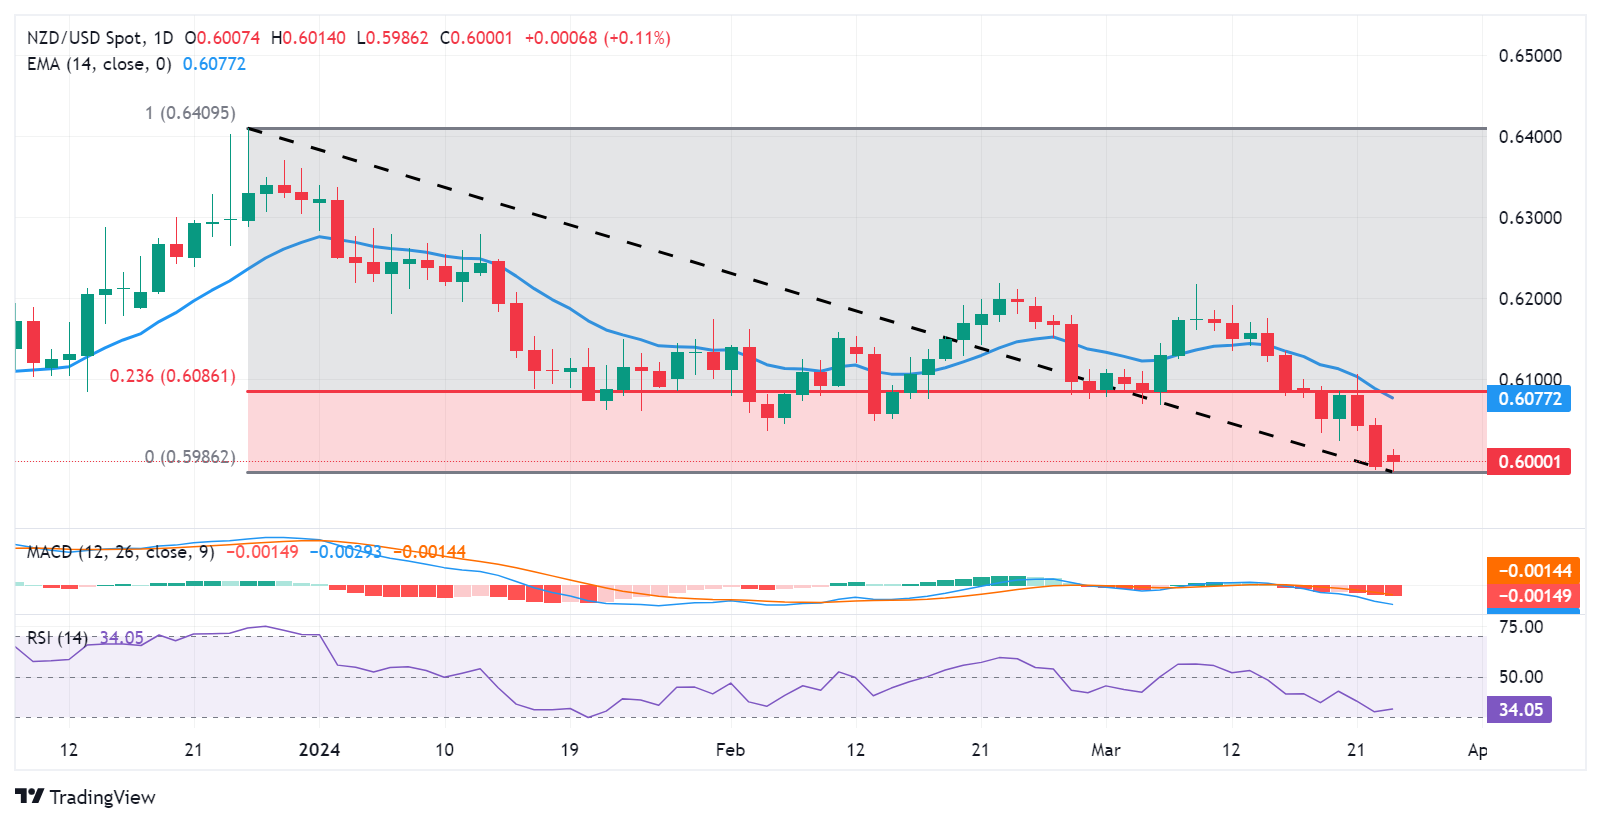
  • The break above 0.6050 could lead the pair to navigate the area around the 14-day EMA and the 23.6% Fibonacci level.
  • The major level of 0.5950 could act as support, following the psychological support at 0.5900 level.

NZD/USD continues its losing streak for the third successive session as the US Dollar (USD) falls on the dovish sentiment surrounding the Federal Reserve's stance on the trajectory of interest rates, with market sentiment leaning towards the Fed initiating interest rate cuts starting in June. The pair has trimmed its intraday gains and hovers around the psychological level of 0.6000 during the European session on Monday.

The NZD/USD pair could find a key barrier lies at the major level of 0.6050. A break above this level could lead the pair to navigate the area around the 14-day Exponential Moving Average (EMA) of 0.6076 and the 23.6% Fibonacci retracement level of 0.6086. A further movement could test the psychological level of 0.6100.

According to the Moving Average Convergence Divergence (MACD) analysis, a prevailing downward sentiment is indicated for the NZD/USD pair. This is evidenced by the MACD line positioned below the centerline and shows the divergence below the signal line, signaling a bearish trend. Furthermore, the 14-day Relative Strength Index (RSI) is below the 50 level, providing additional confirmation of the bearish sentiment.

On the downside, the NZD/USD pair could find the key support at the major level of 0.5950. A break below the latter could put pressure on the pair to navigate further support at a psychological level of 0.5900.

NZD/USD: Daily Chart

NZD/USD

Overview
Today last price0.5998
Today Daily Change0.0005
Today Daily Change %0.08
Today daily open0.5993
 
Trends
Daily SMA200.6112
Daily SMA500.6117
Daily SMA1000.6134
Daily SMA2000.6077
 
Levels
Previous Daily High0.6052
Previous Daily Low0.5989
Previous Weekly High0.6107
Previous Weekly Low0.5989
Previous Monthly High0.6219
Previous Monthly Low0.6037
Daily Fibonacci 38.2%0.6013
Daily Fibonacci 61.8%0.6028
Daily Pivot Point S10.5971
Daily Pivot Point S20.5948
Daily Pivot Point S30.5908
Daily Pivot Point R10.6034
Daily Pivot Point R20.6075
Daily Pivot Point R30.6097

Author

Akhtar Faruqui

Akhtar Faruqui is a Forex Analyst based in New Delhi, India. With a keen eye for market trends and a passion for dissecting complex financial dynamics, he is dedicated to delivering accurate and insightful Forex news and analysis.

More from Akhtar Faruqui
Share:

Editor's Picks

EUR/USD remains offered below 1.1600, seems vulnerable near multi-month low

The EUR/USD pair struggles to capitalize on the overnight bounce from the 1.1530 region, or the lowest level since November 2025, and lower for the third consecutive day on Wednesday. Spot prices slide back below the 1.1600 mark during the Asian session and seem vulnerable to slide further.

GBP/USD slips below key averages as geopolitical risks mount

GBP/USD fell about 0.35% on Tuesday, settling around 1.3350 after slipping below the 200-day Exponential Moving Average for the first time since early December. The pair has pulled back sharply from its late-January high near 1.3870, shedding over 500 pips in a series of lower highs and lower lows. 

Gold rebounds ahead of US ADP, will it last?

Gold finds renewed Asian bids and retests $5,230 early Wednesday after the heavy sell-off on Tuesday. The US Dollar stands tall amid escalating Middle East tensions and reduced dovish Fed expectations. Gold defends $5,000 or 50% Fibo level after facing rejection at the 78.6% Fibo resistance at $5,342 amid bullish RSI.  

Bitcoin, Ethereum and Ripple struggle for direction as consolidation persists

Bitcoin, Ethereum and Ripple prices trade with a cautious tone at the time of writing on Wednesday as upside momentum continues to fade across the broader crypto market. BTC remains within a parallel channel, ETH struggles below key resistance, while XRP remains fragile within a descending channel. These top three cryptocurrencies by market capitalization continue to struggle to establish a directional bias amid the consolidation phase.

Energy shock 2.0: Why rising Gas prices could hit the Euro

Even without a confirmed, sustained disruption, the mere risk to a key global energy chokepoint is enough to inject a significant premium into European Gas markets. And for the Euro, that matters.

Ripple falters amid sell-off jitters and negative funding rates

Ripple (XRP) has come under pressure, drifting lower to $1.35 at the time of writing on Tuesday. The over 2% correction looks poised to erase the previous day’s gains, which lifted the remittance token to $1.42.